Dashboard Inspiration
Any look. Same spec.
Ten example dashboards in the style of apps you already use, rebuilt panel by panel from ChartSpec. Not templates to copy, just proof that the default ChartKit theme is only a starting point. Click through the examples below.
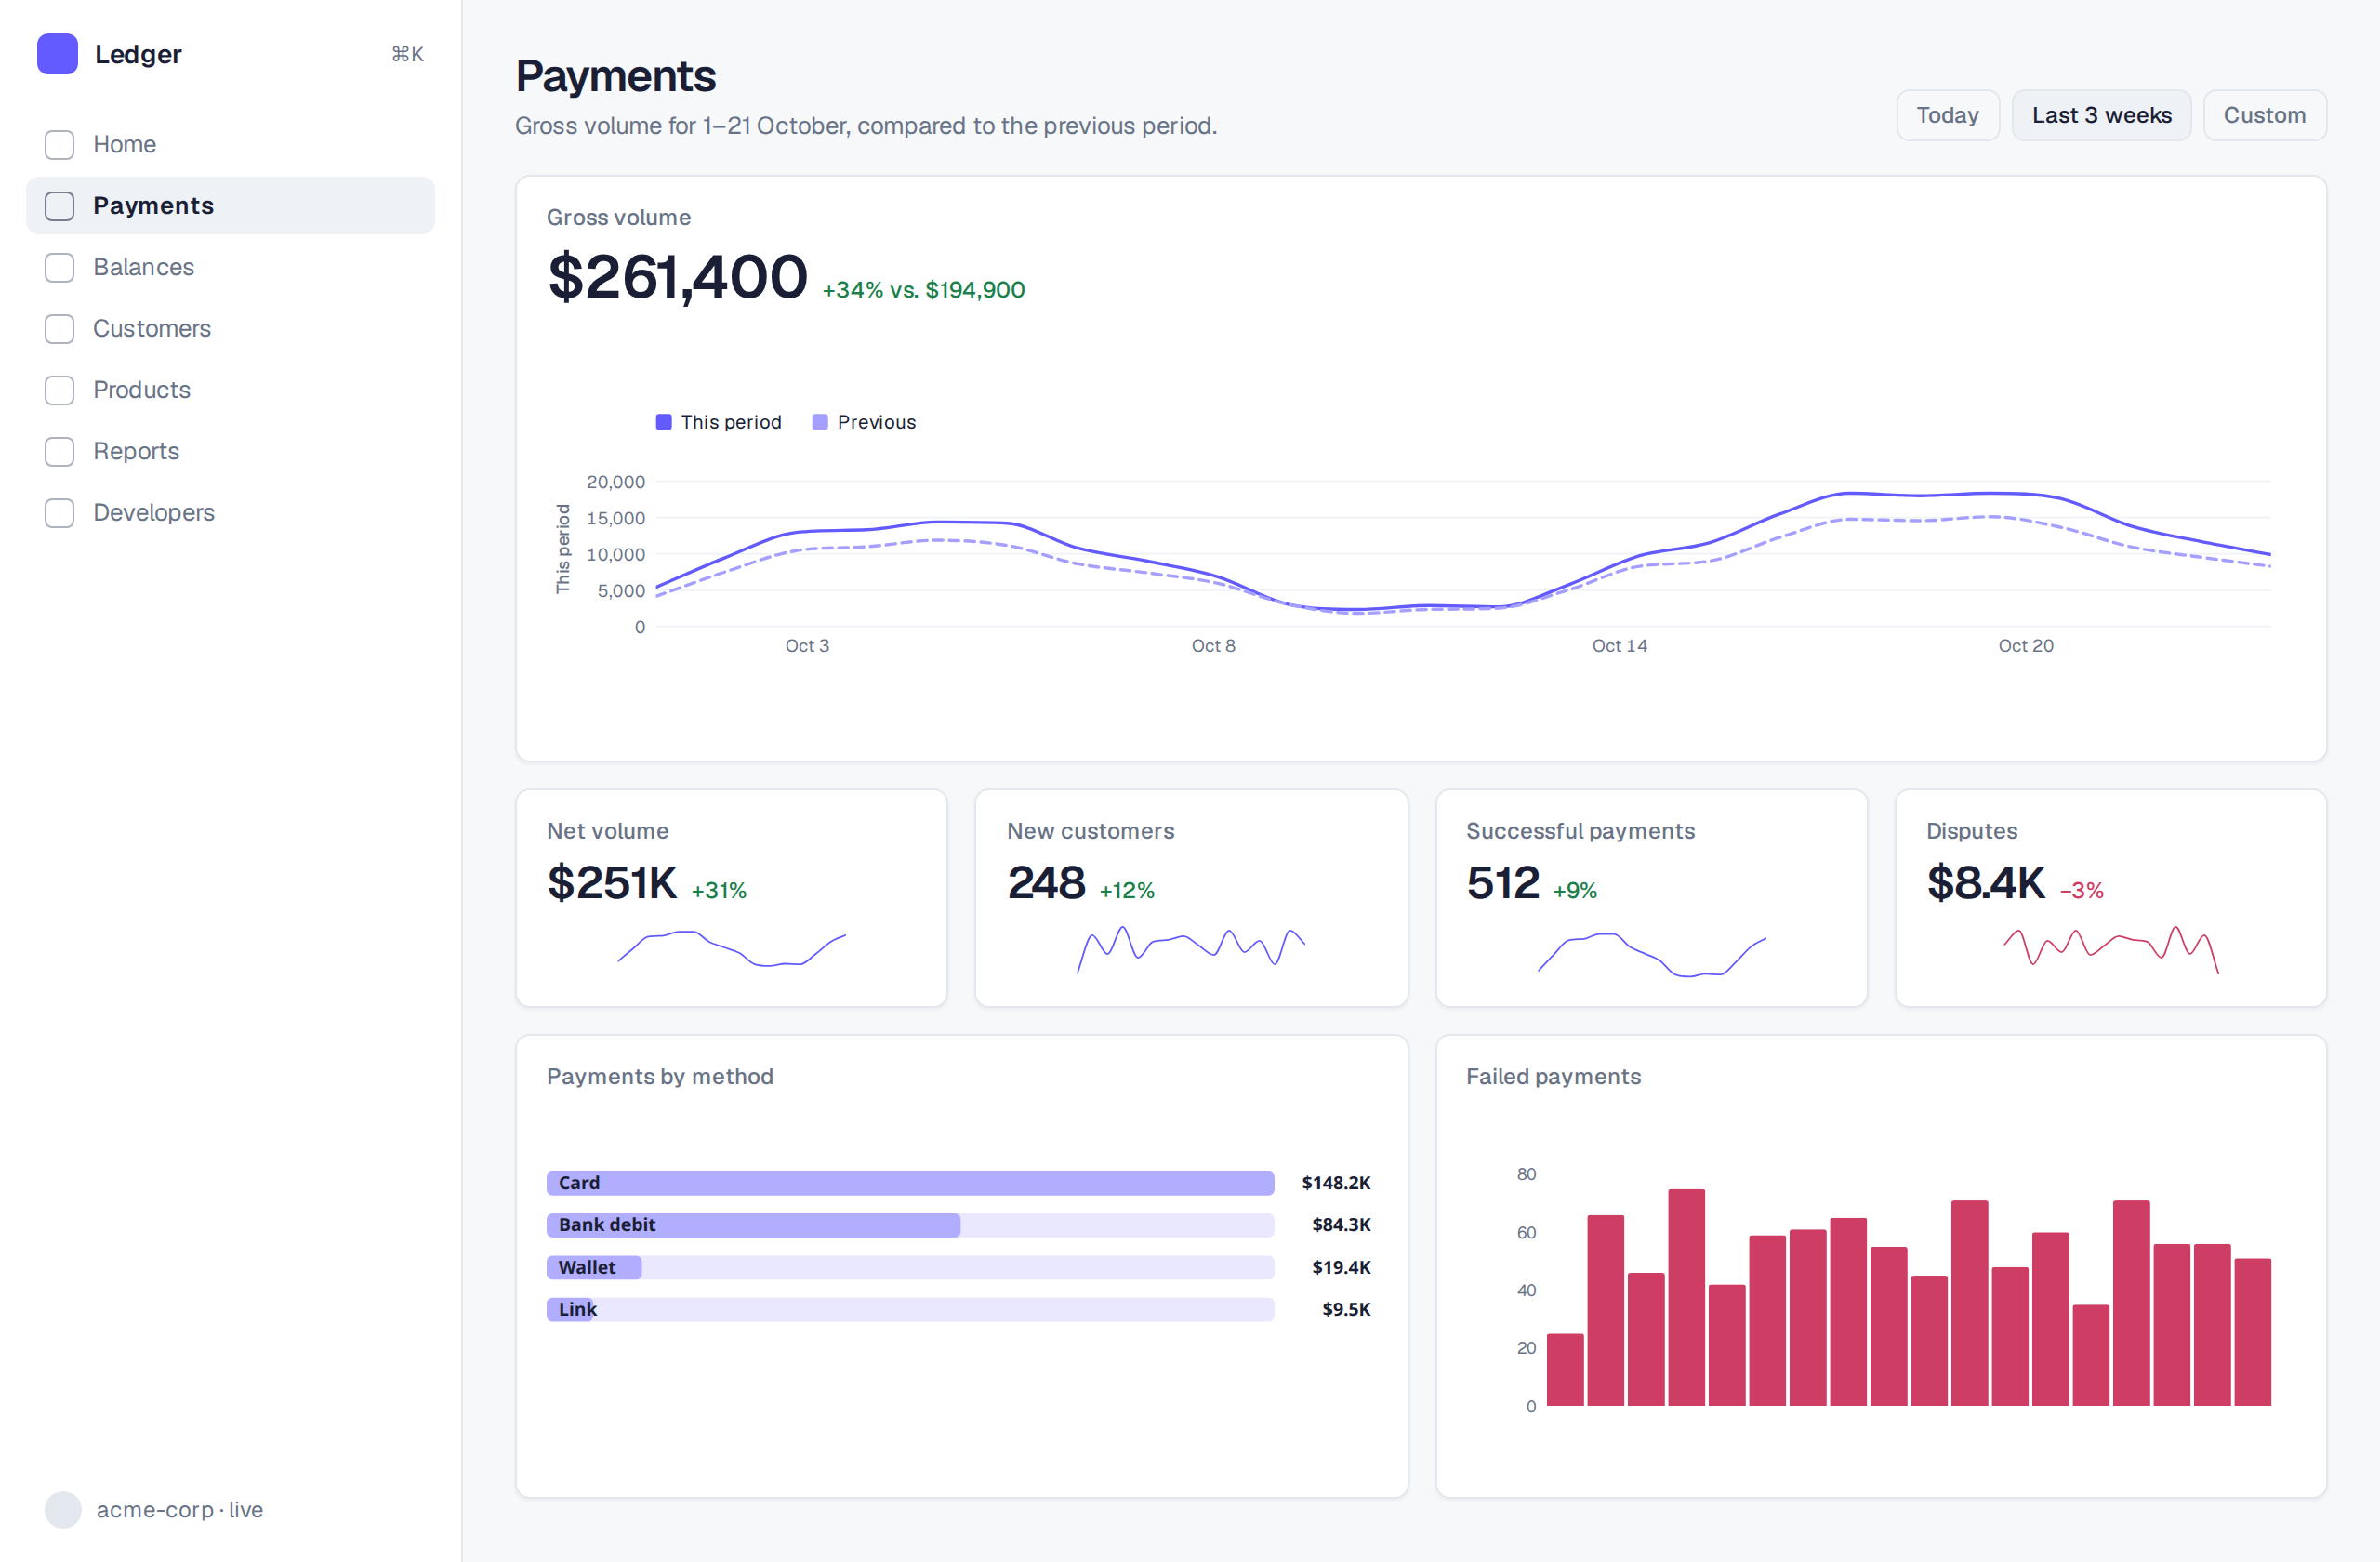
Hero metric with a dotted comparison period, a row of sparkline KPIs, and a ranked breakdown.
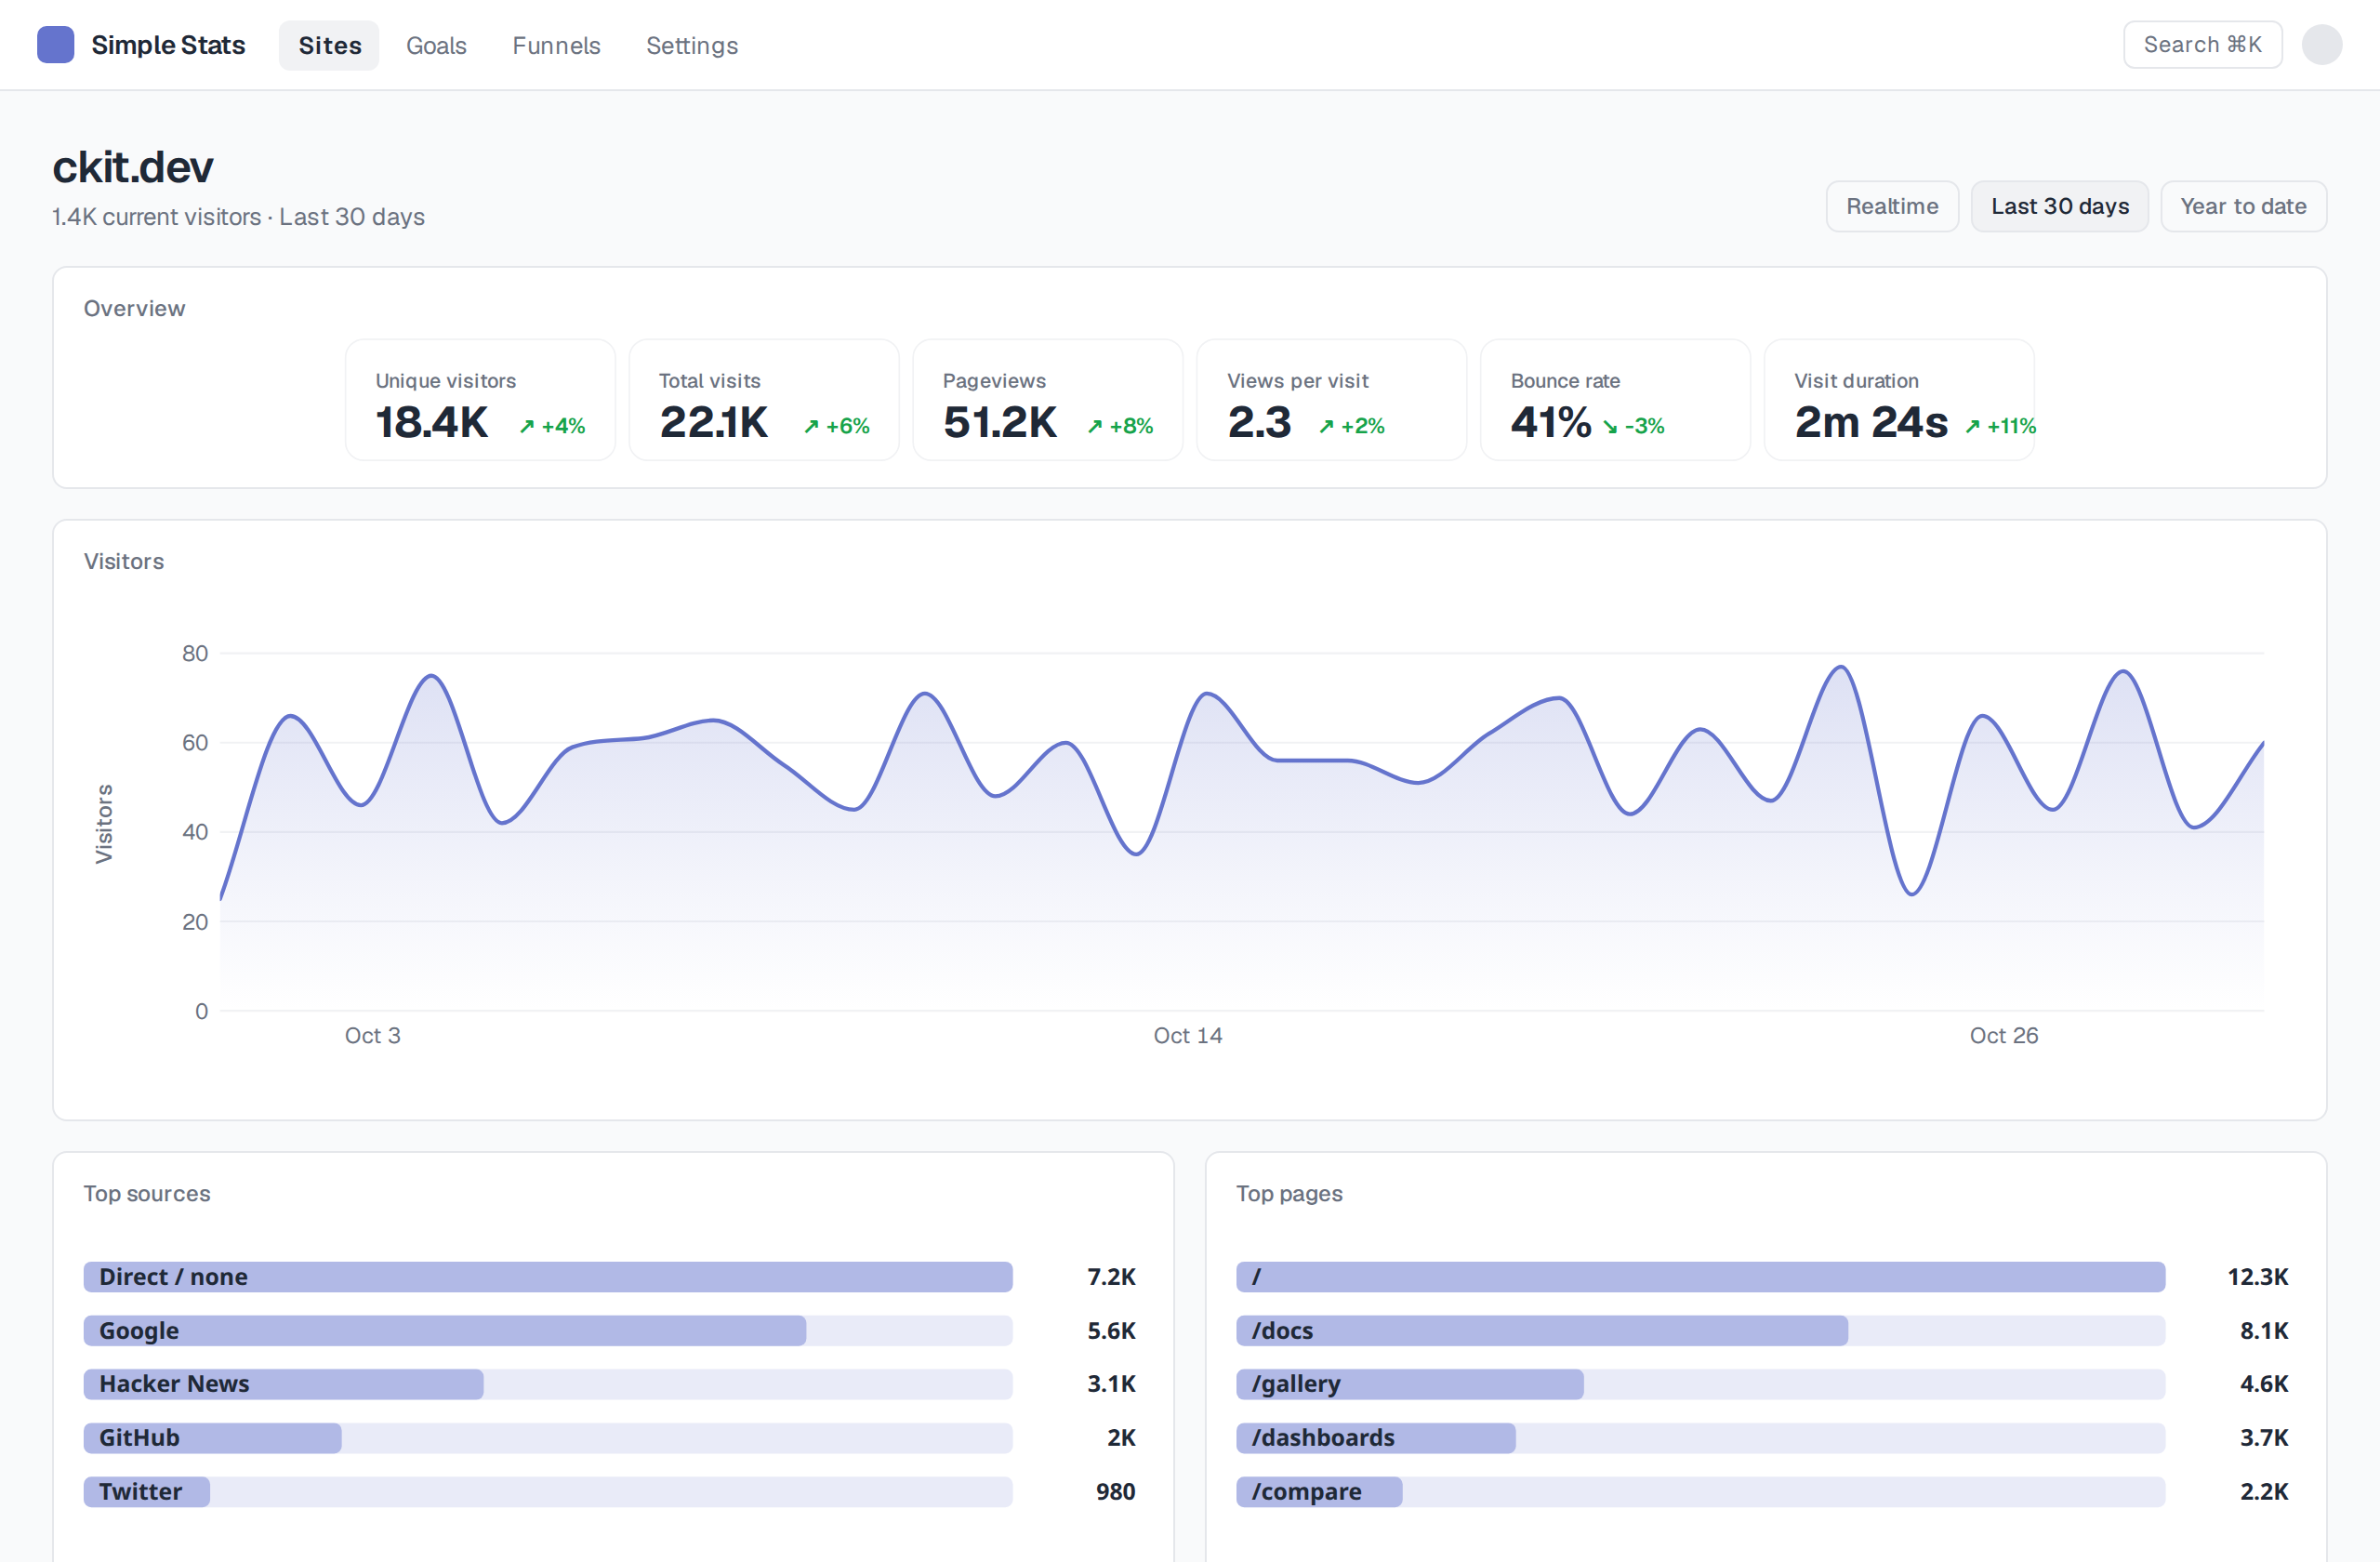
One big area chart under a KPI strip, with tabbed source breakdowns underneath.
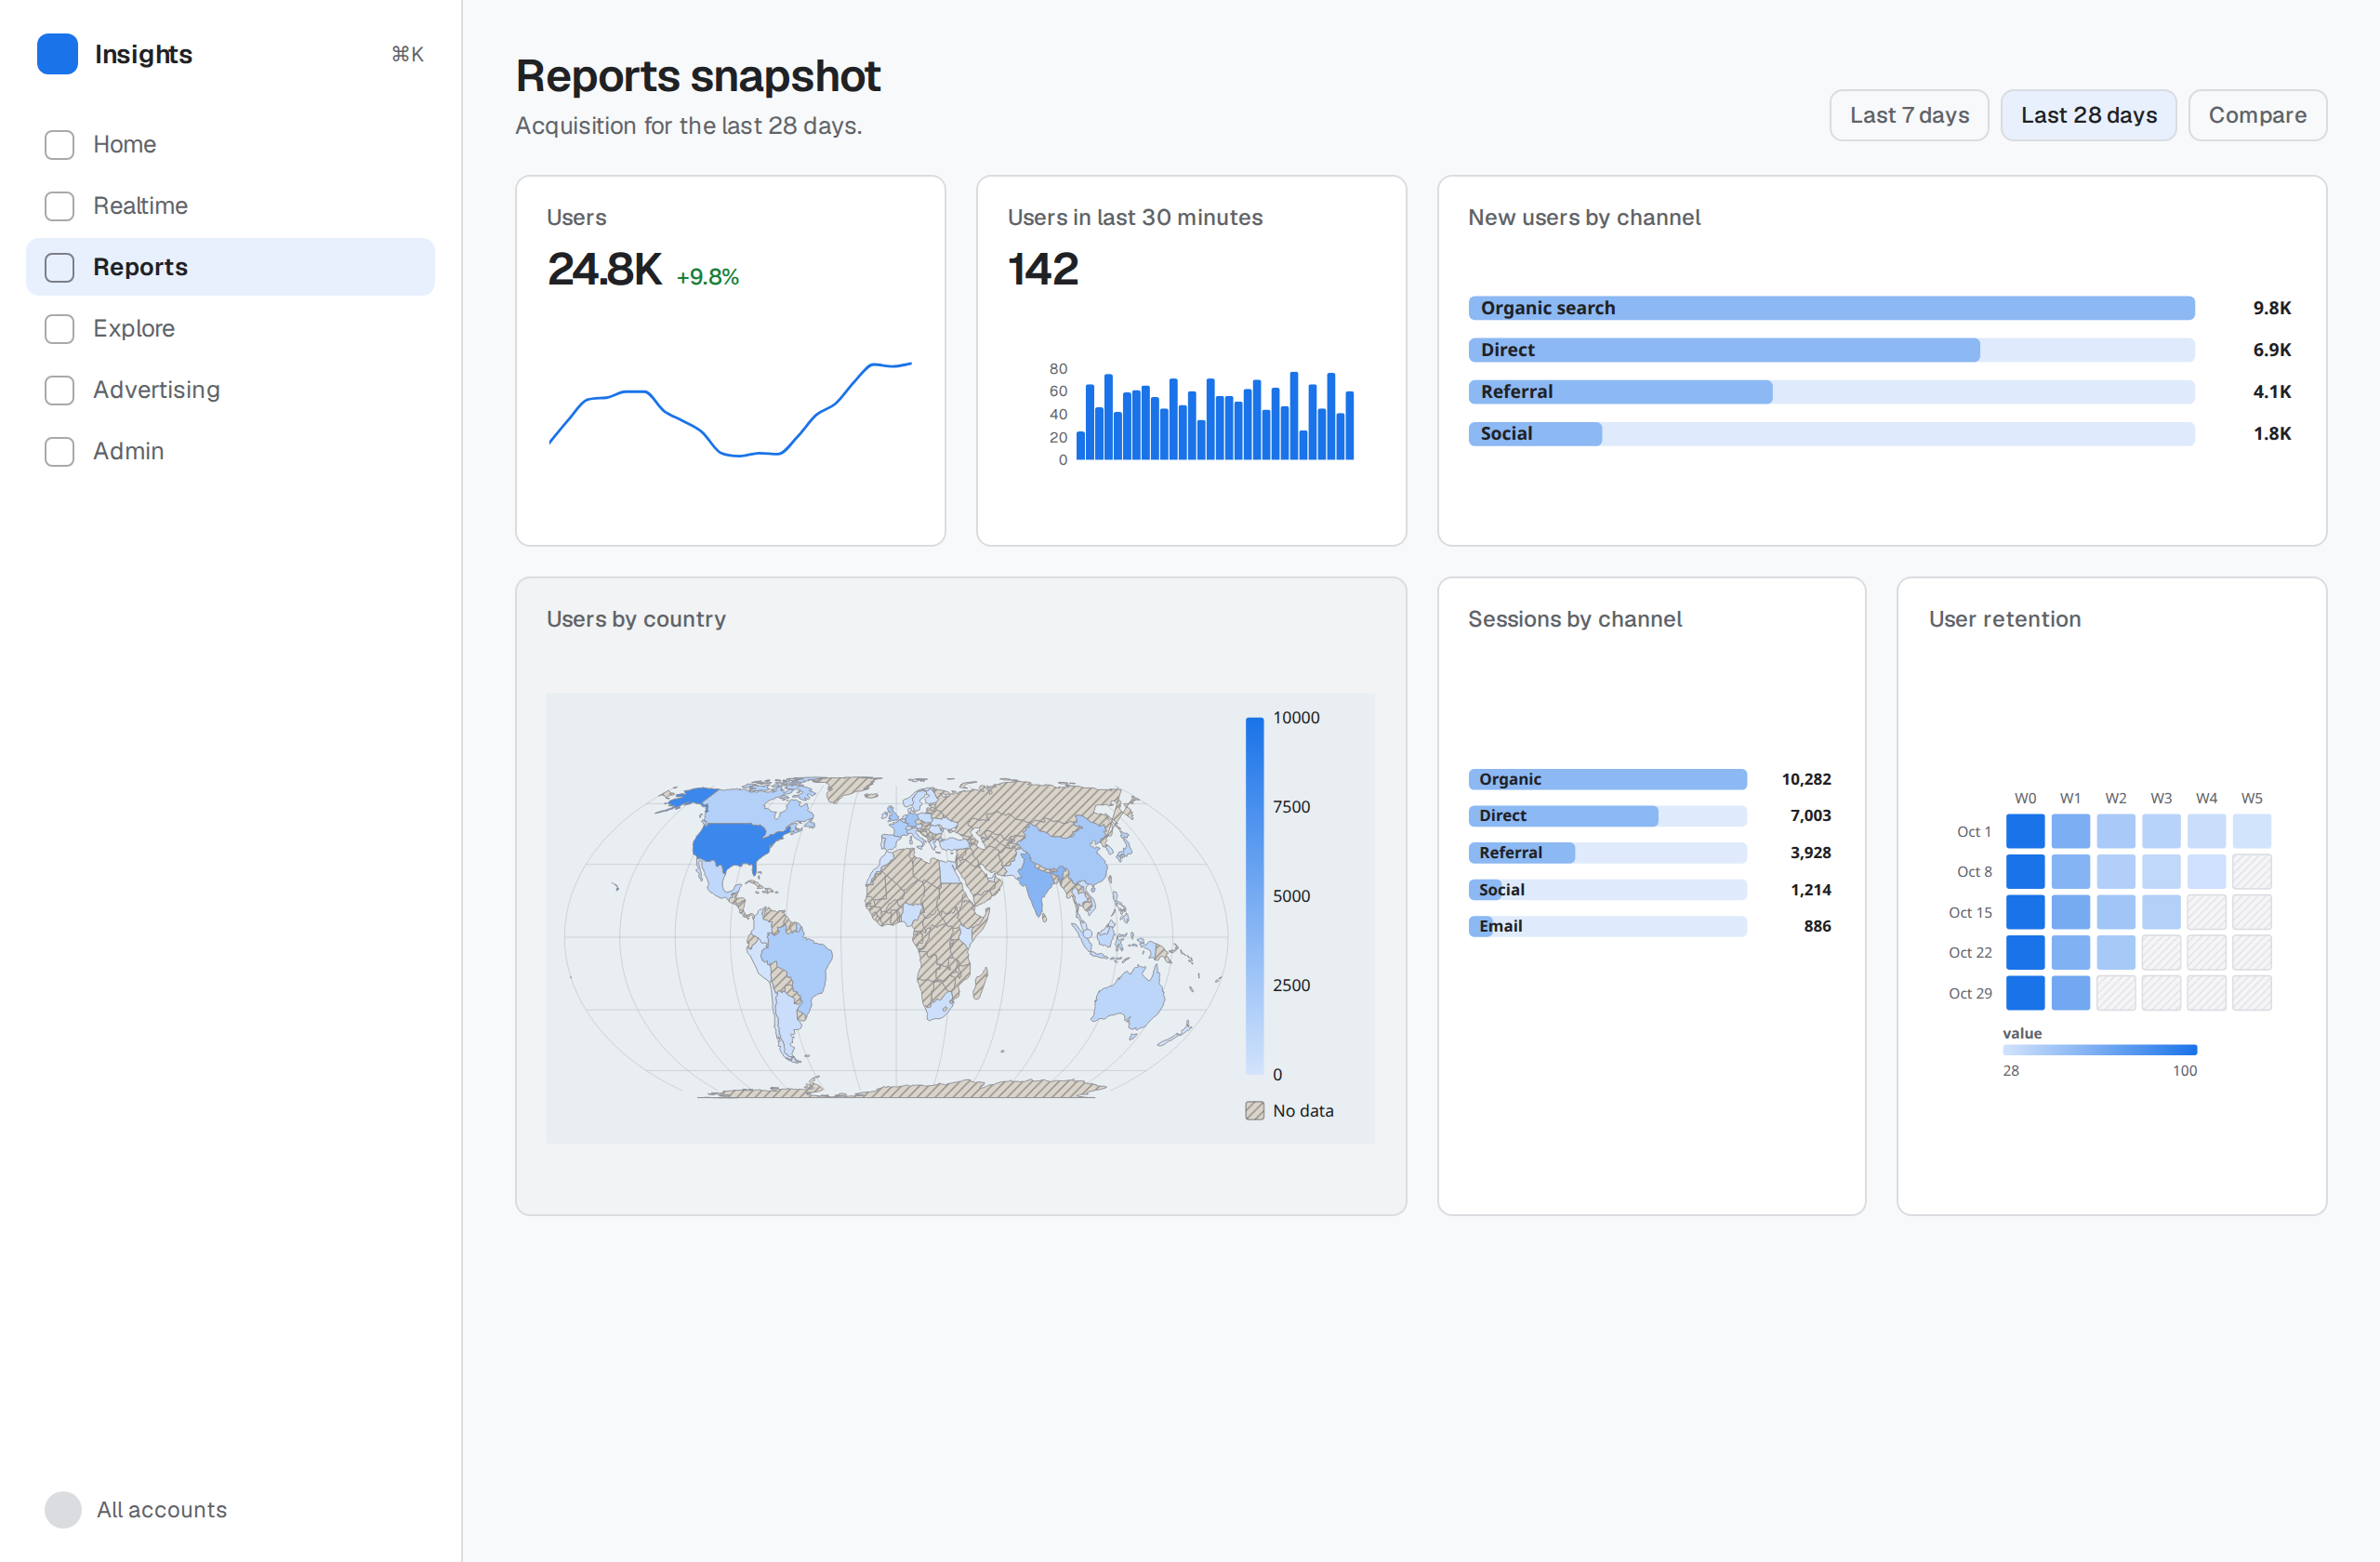
Dense card grid: realtime counter, geo map, channel table, user cohort heatmap.
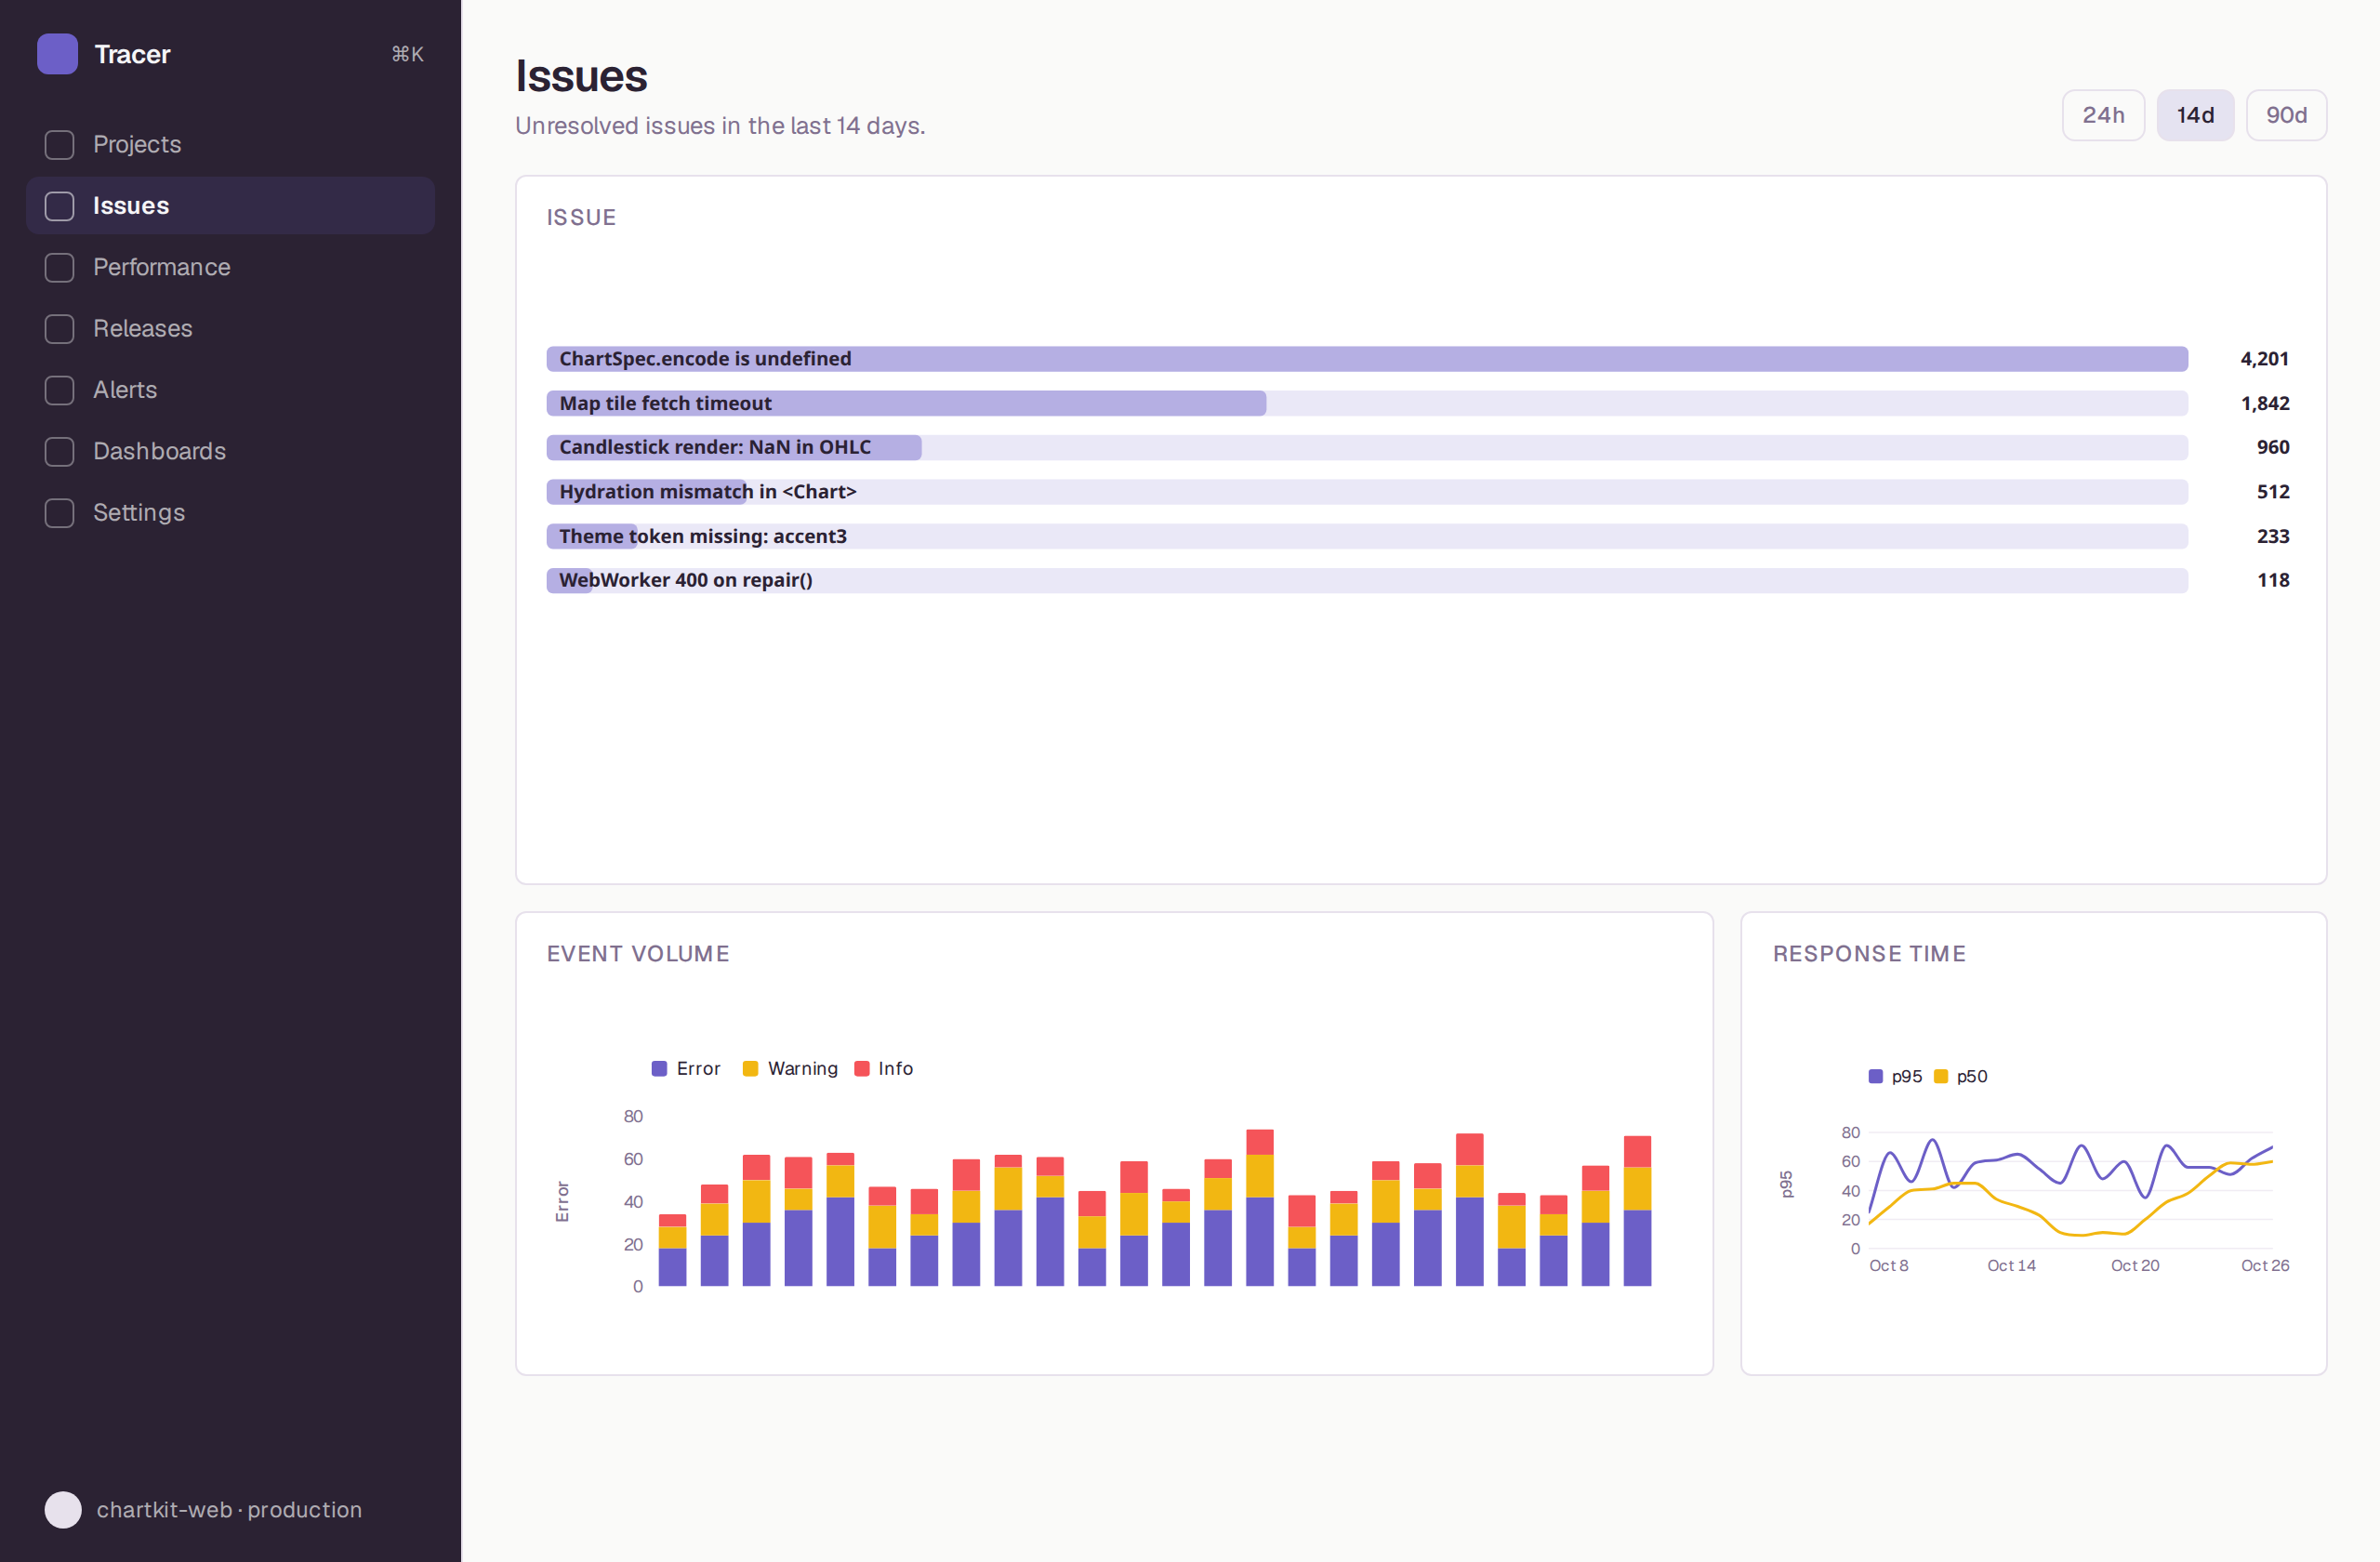
A table where every row carries an inline sparkline, plus stacked event volume.
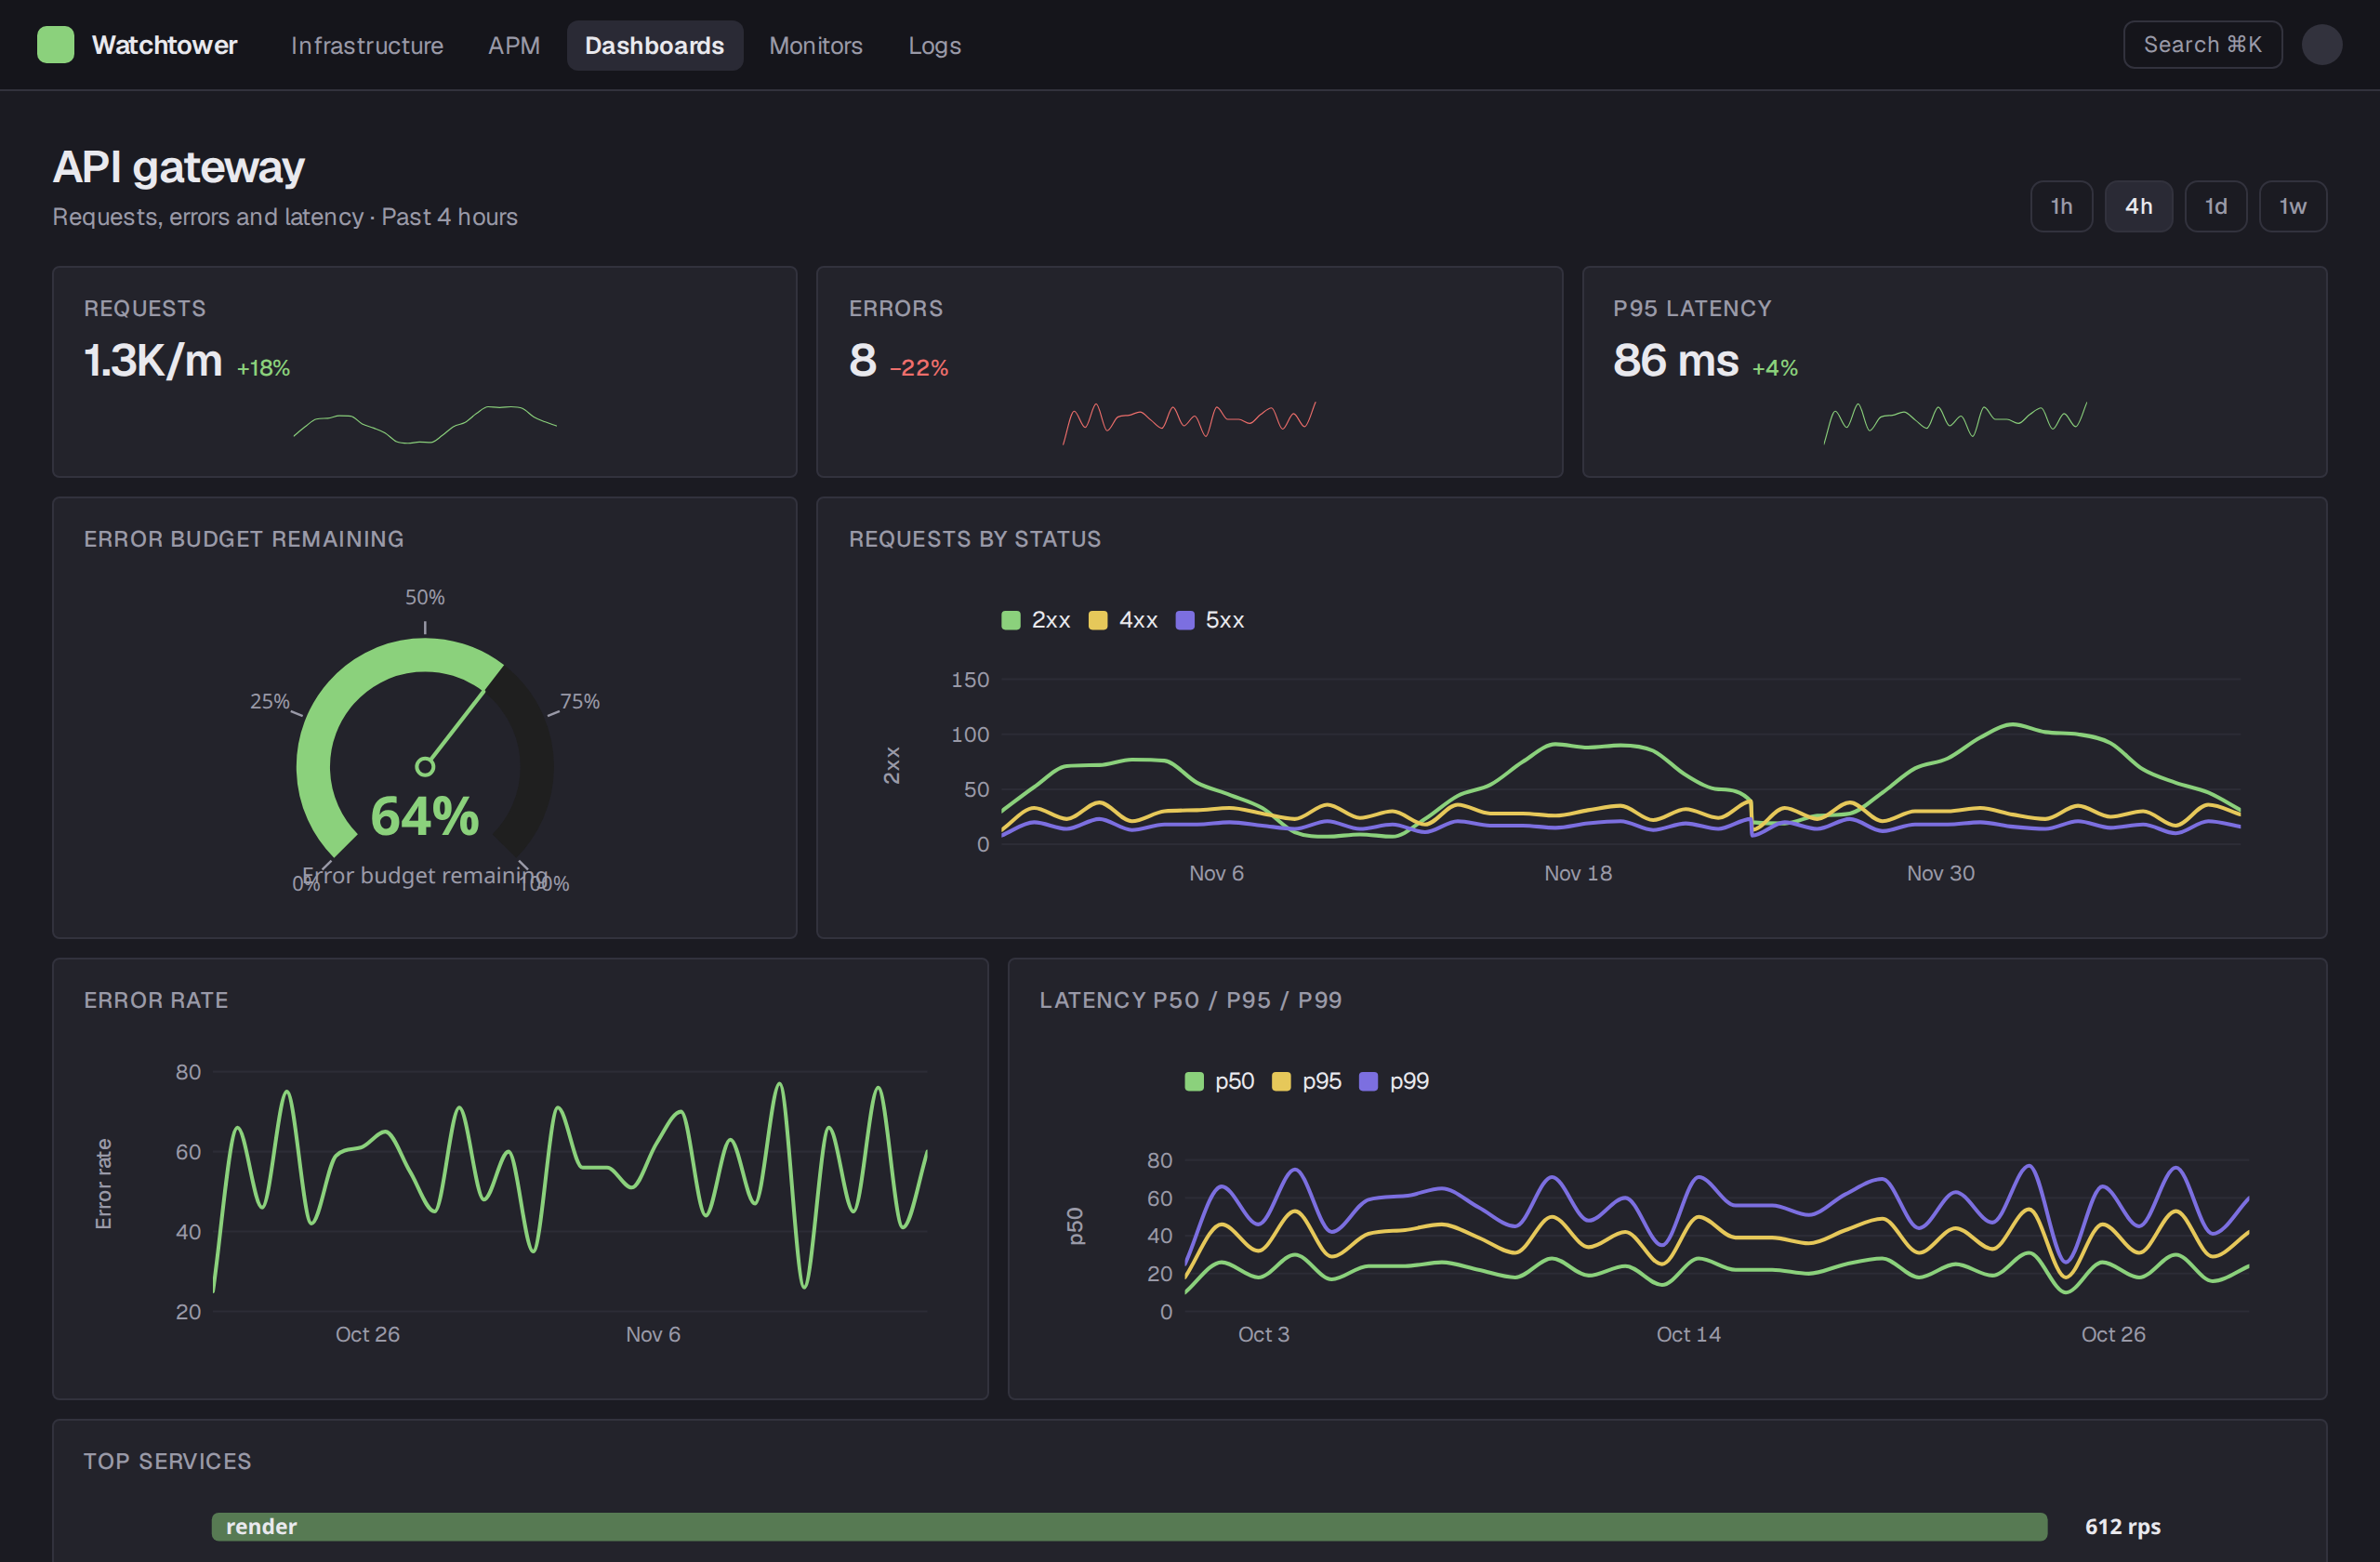
Dark ops board: big-number tiles, a gauge, and multi-series latency lines.
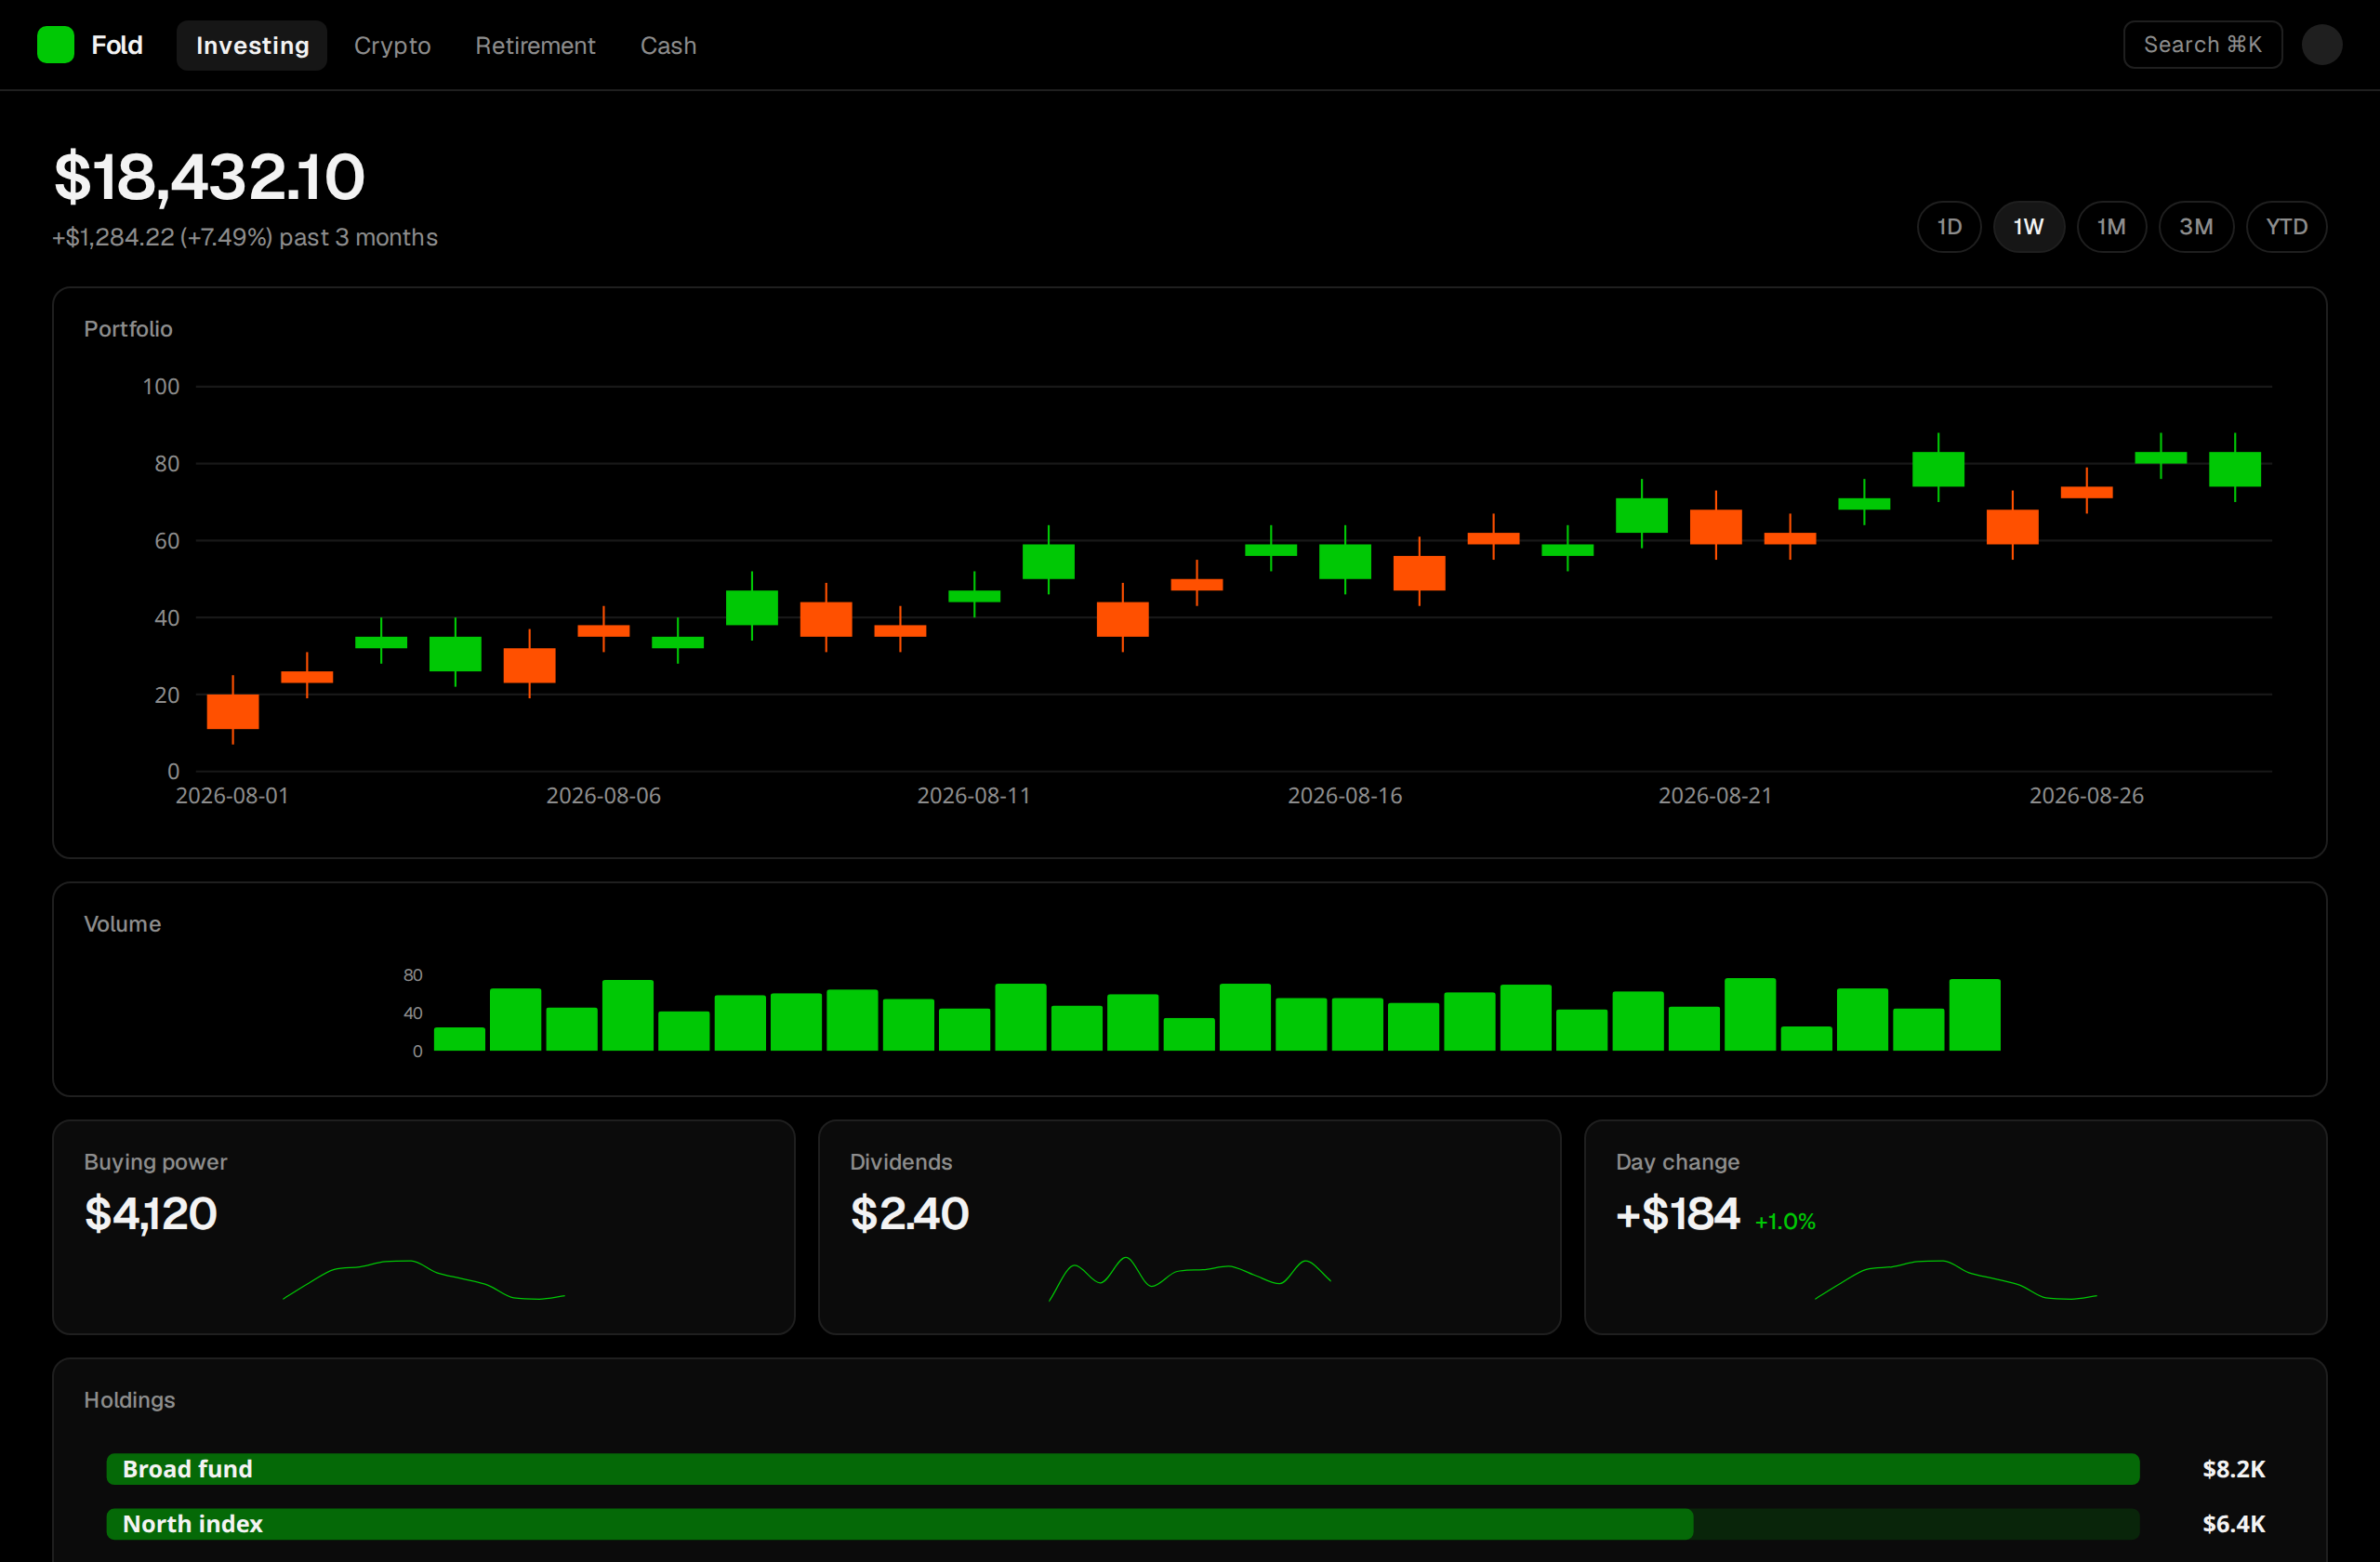
Candlesticks over volume, green-on-black, with holdings as a weighted bar list.
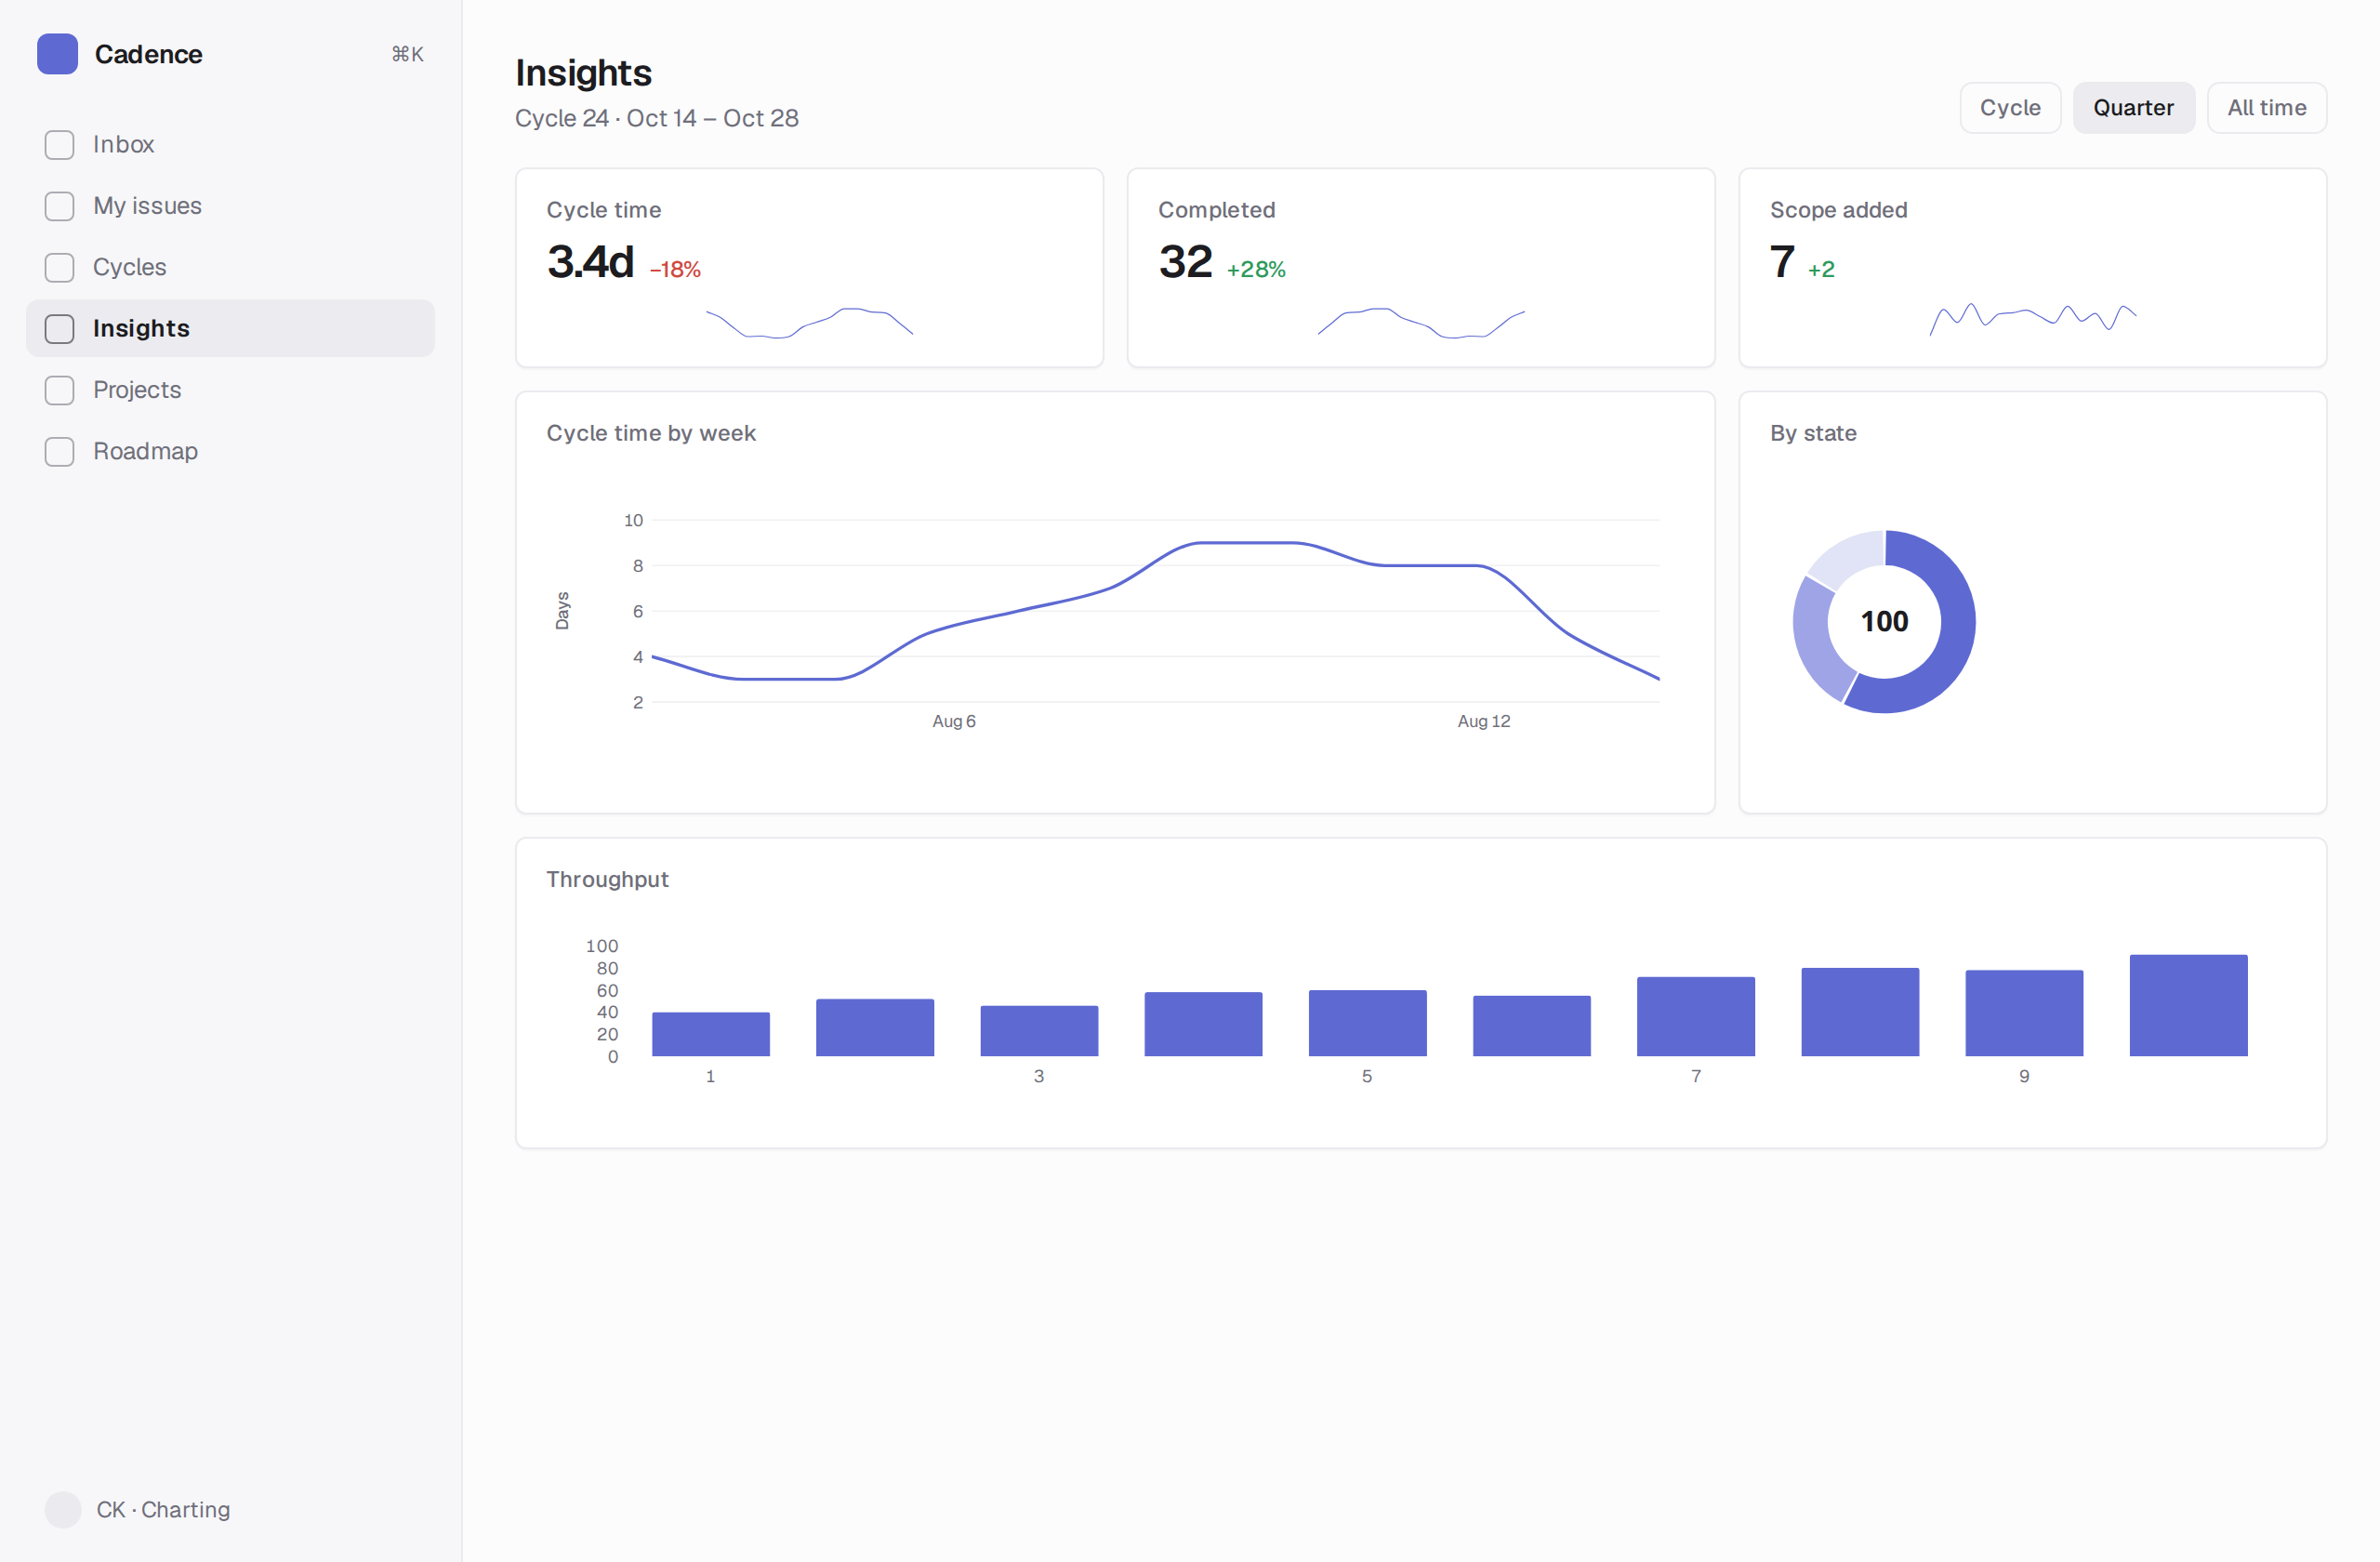
Quiet, compact cycle metrics: cycle-time line, a donut by state, and throughput bars.
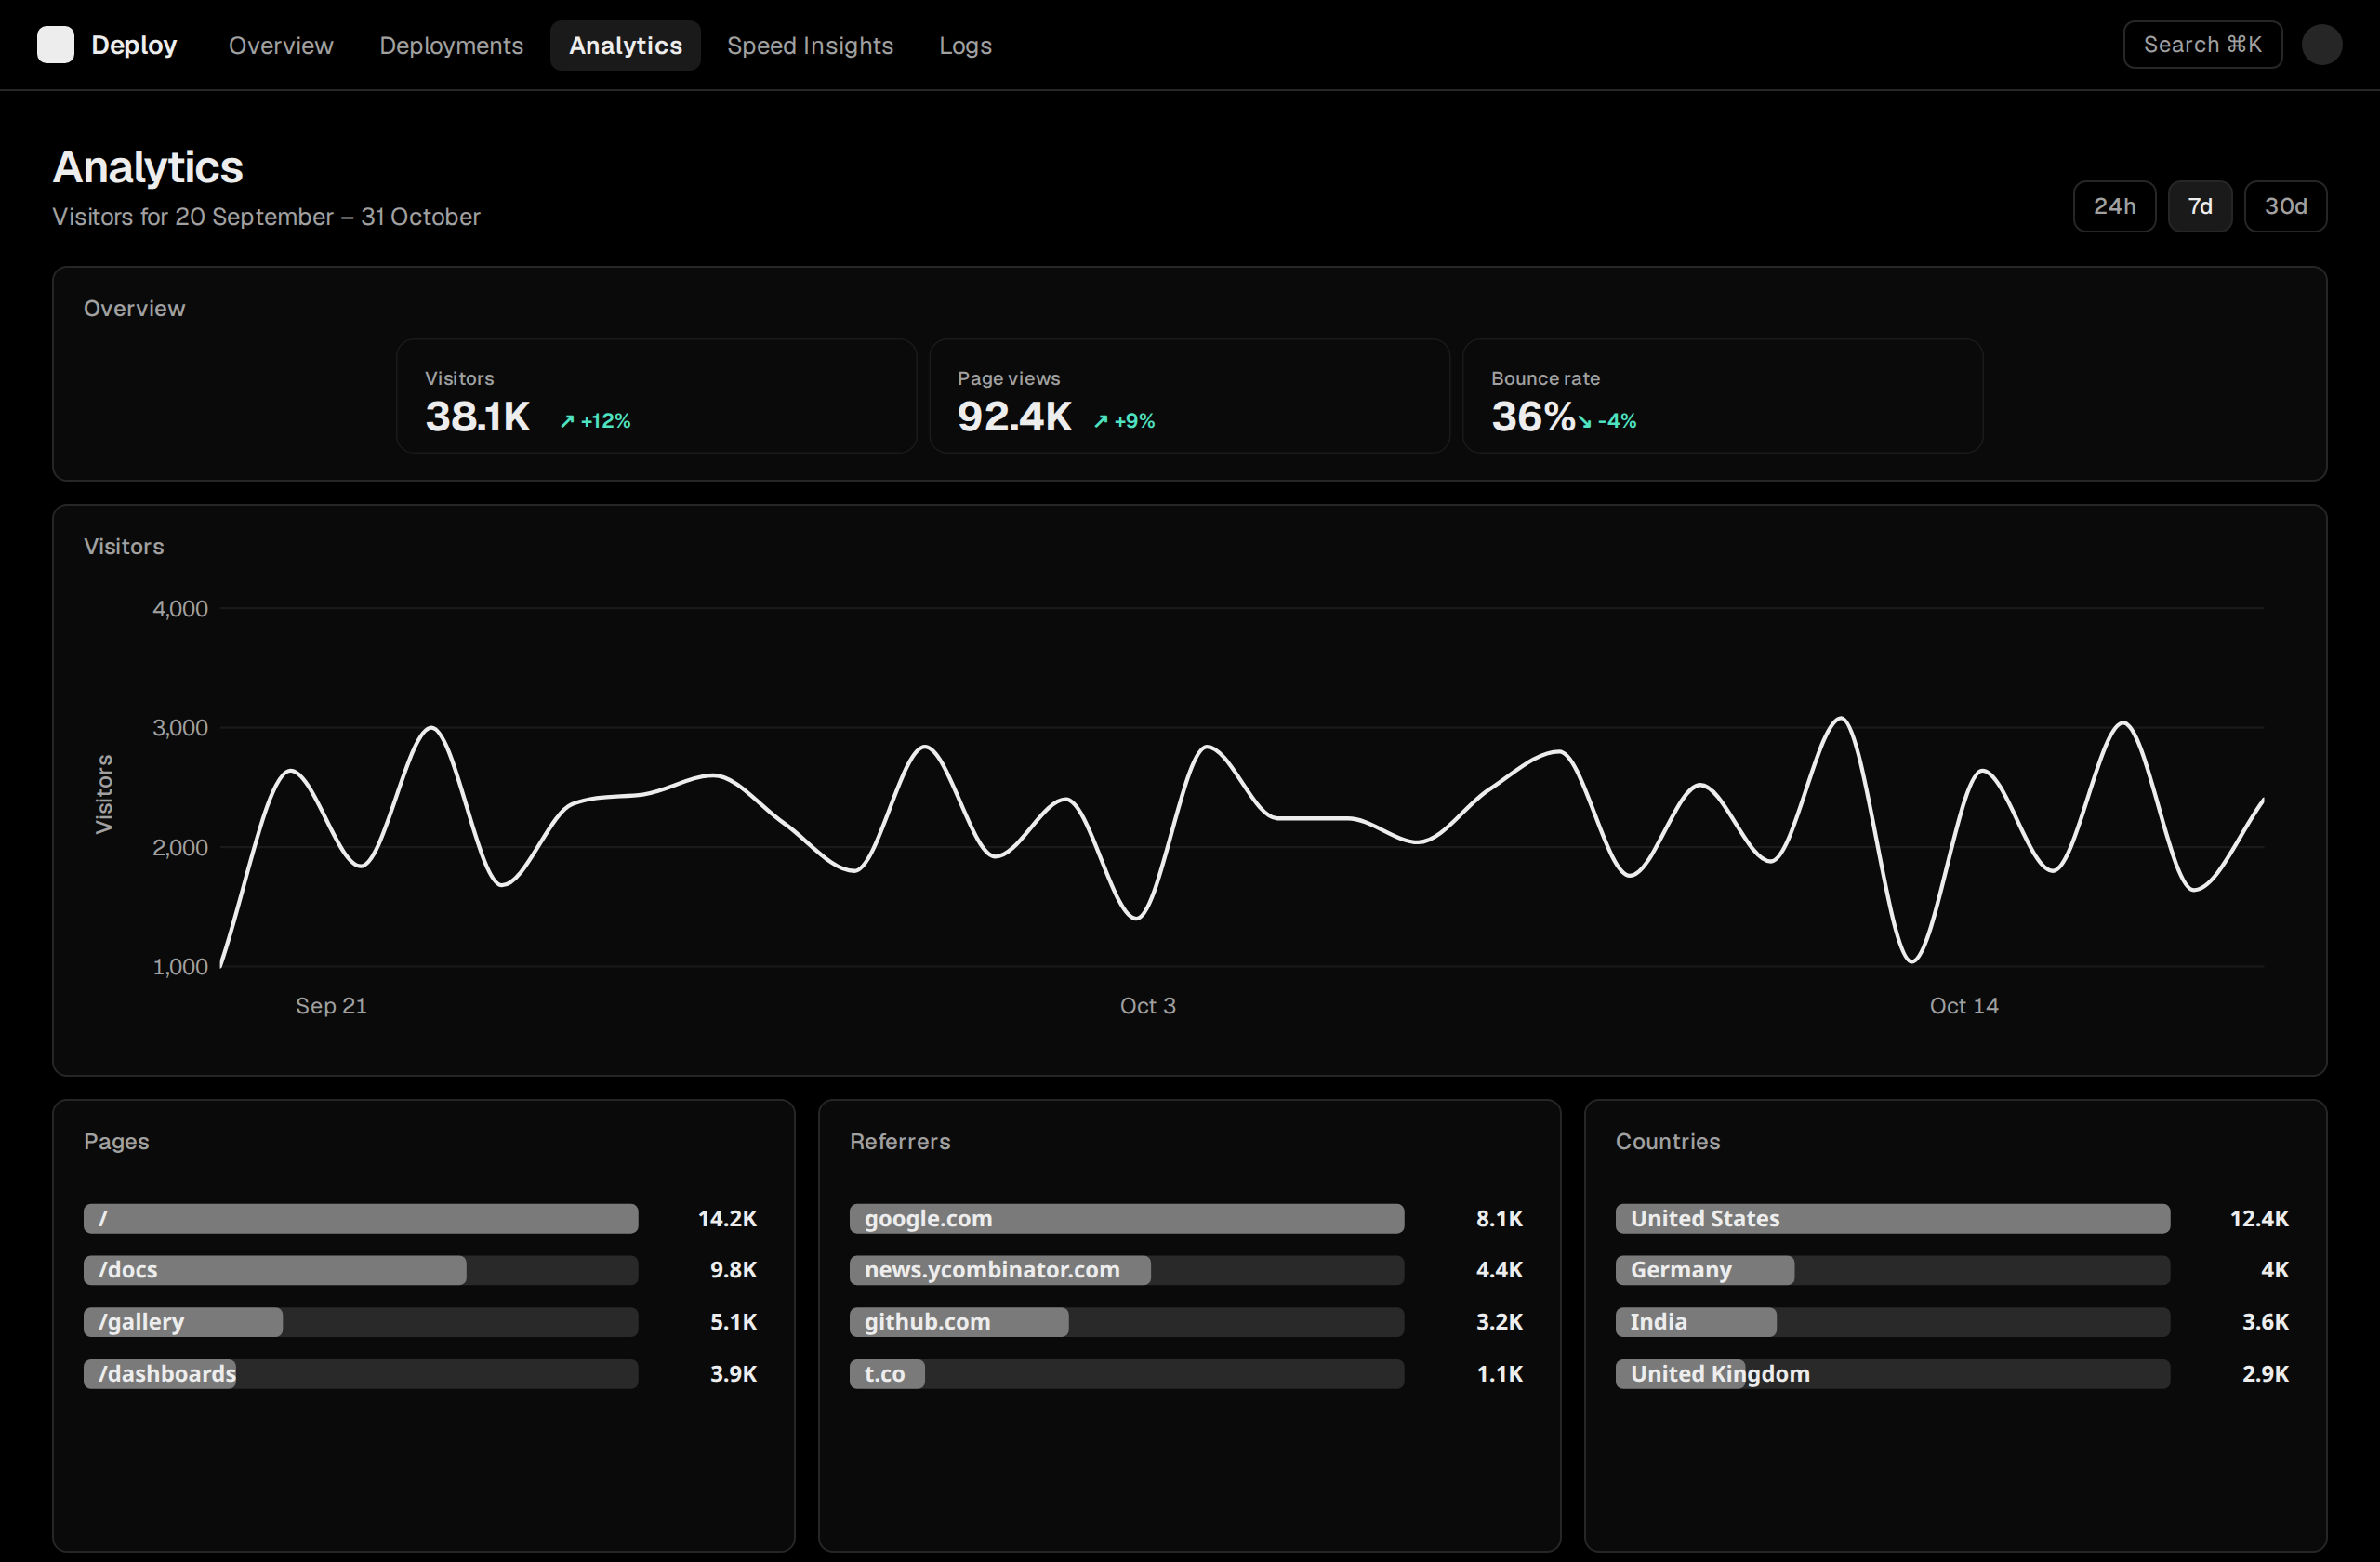
Monochrome. One thick line, hairline grid, and three source tables side by side.
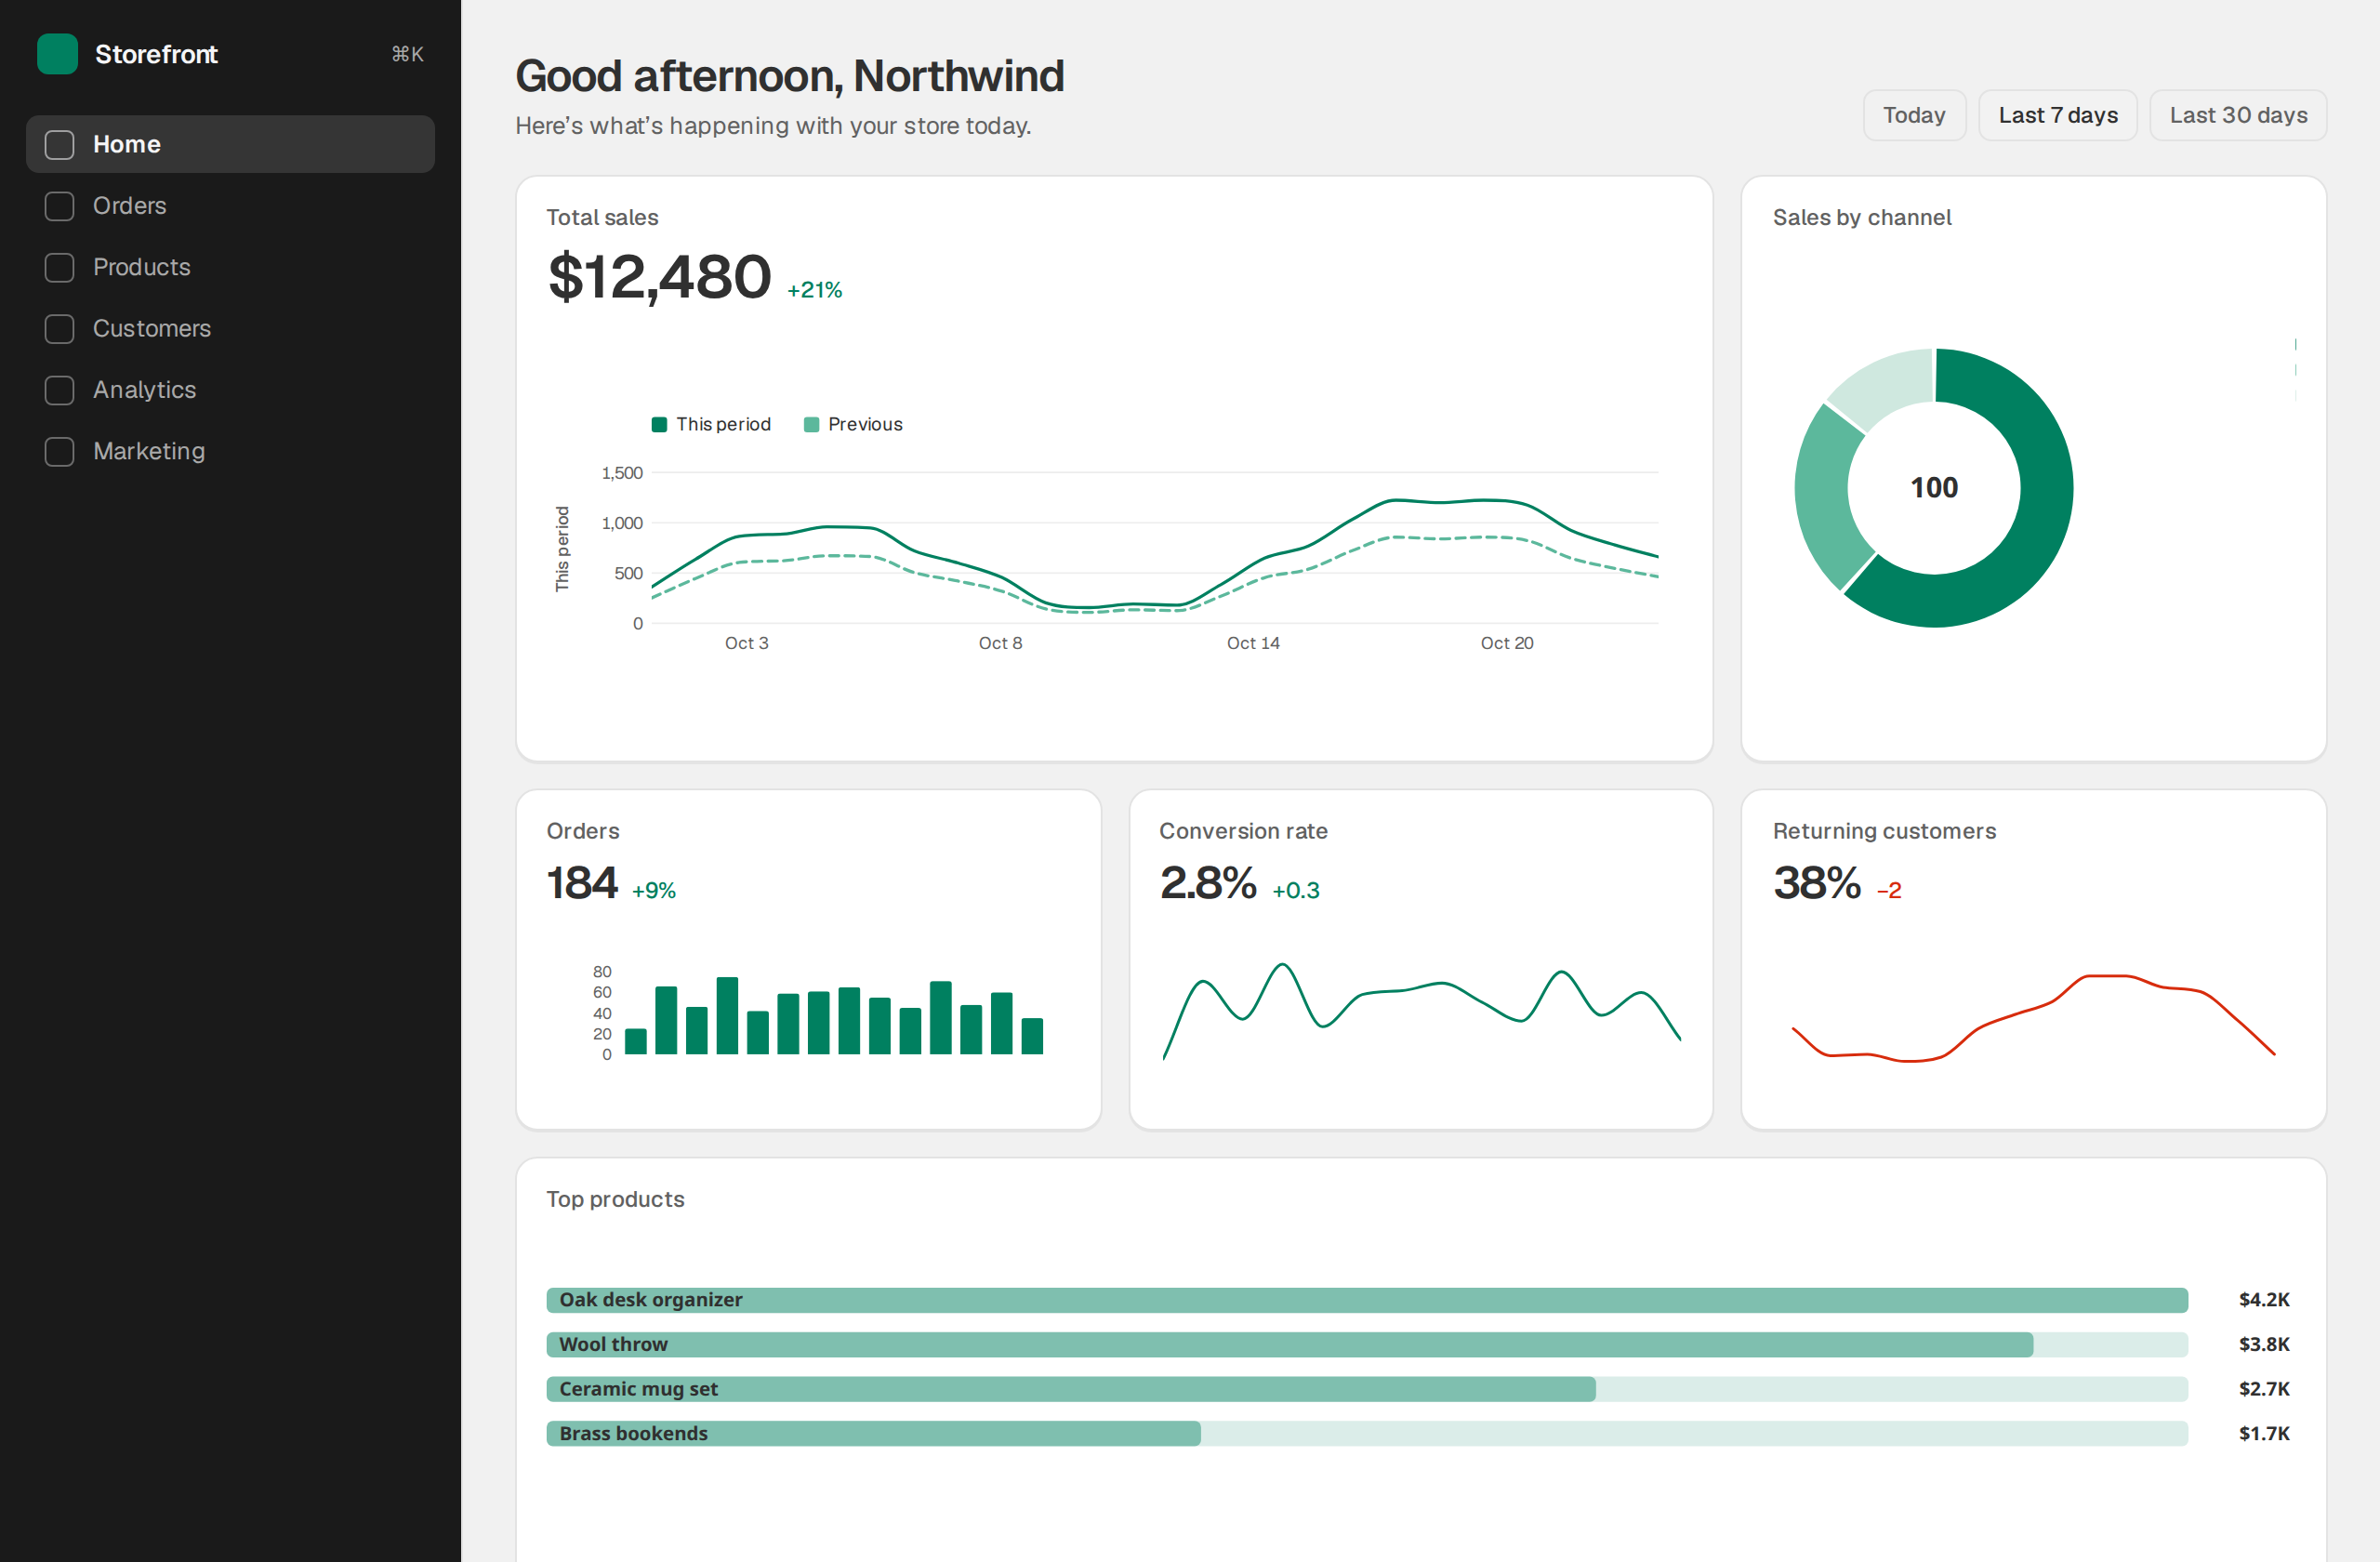
Merchant home: sales line with comparison, channel donut, and a top-products table.
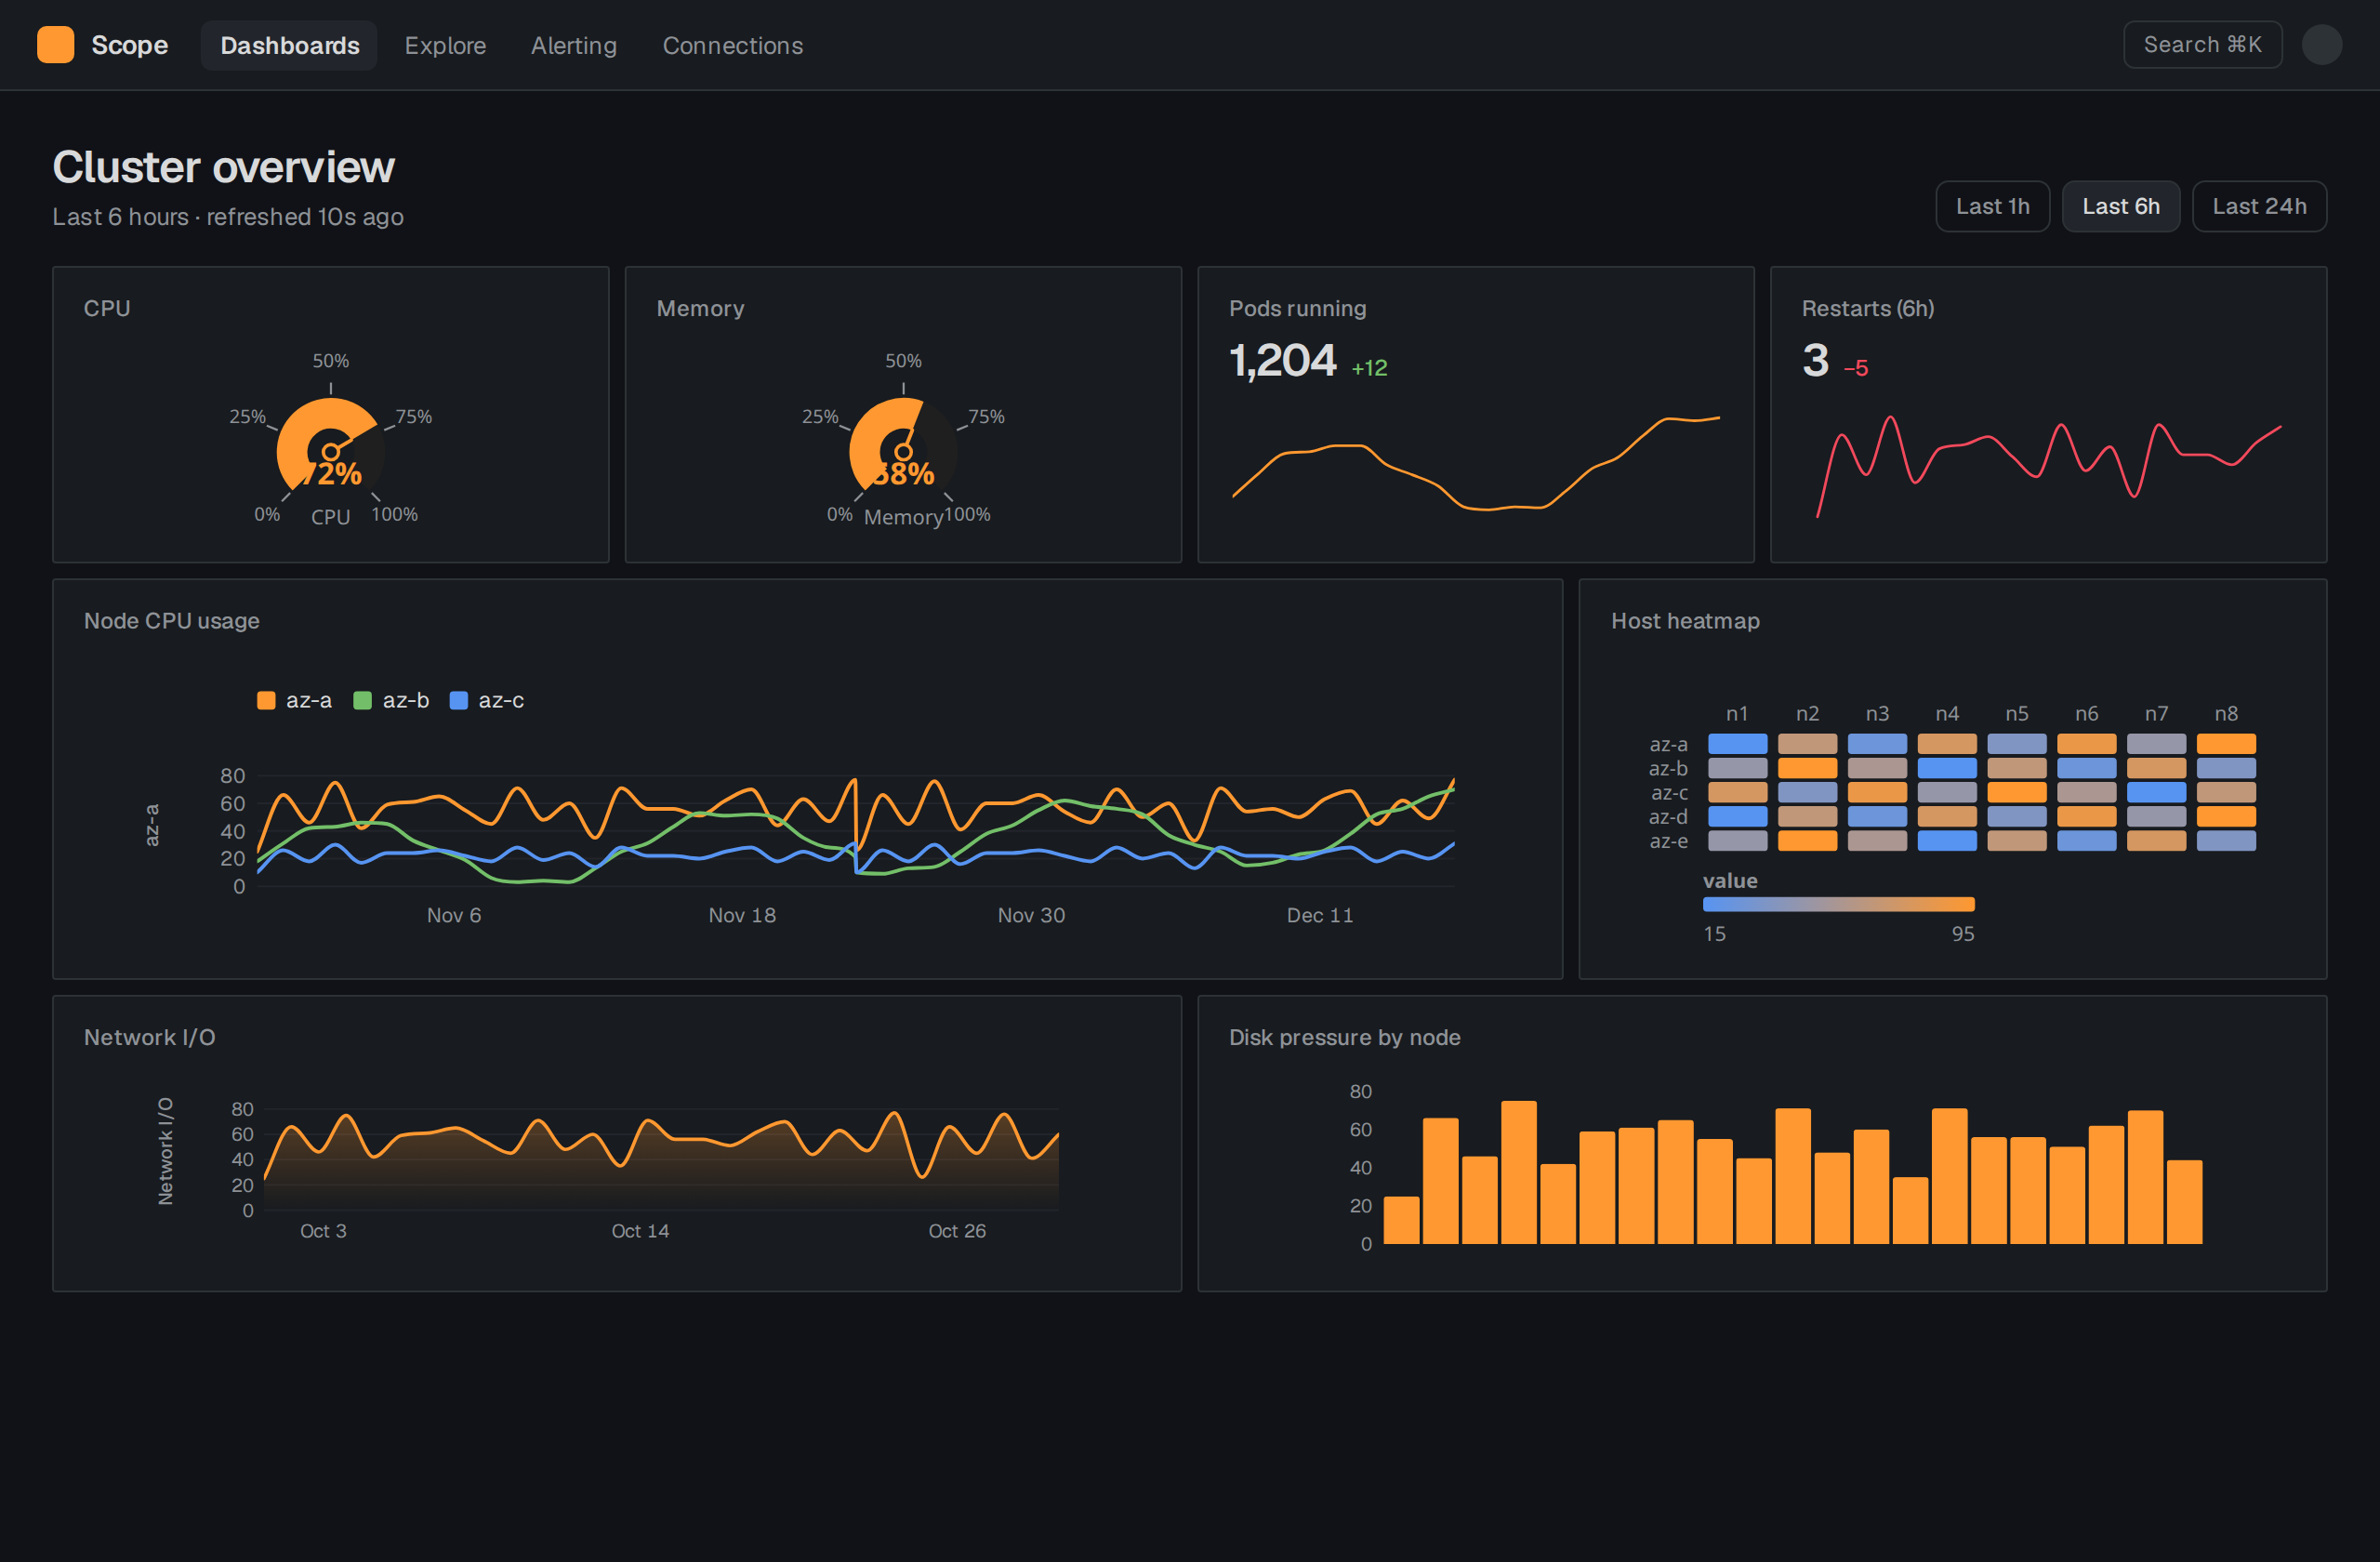
Tight panels, orange accent, status gauges and host heatmap on near-black.