Use Mermaid or Markdown
fromMermaid reads chart syntax models already write and returns a v1 spec plus warnings. toSpec accepts that syntax or a ChartKit JSON object. Both live in @chartkitdev/core/mermaid and are not part of the line bundle.
import { fromMermaid, toSpec } from "@chartkitdev/core/mermaid";

const { spec, warnings } = fromMermaid(`xychart-beta
    title "Weekly orders"
    x-axis [Mon, Tue, Wed, Thu, Fri]
    y-axis "Orders"
    bar "Placed" [12, 18, 15, 22, 30]
    line "Shipped" [10, 14, 16, 20, 28]`);
Charts
Supported Mermaid 11/12 charts:
xychartandxychart-beta: bar and line series, a title, categories or a numeric x range, and a horizontal bar chart.pie, includingshowData(legend values on a pie).sankey-betaCSV rows.radar-beta.treemap-beta.quadrantChart, drawn as a quadrant.quadrant-1throughquadrant-4are top-right, top-left, bottom-left, and bottom-right. An axisLow --> Highbecomes aLow|Hightitle.ganttsections, ISO dates,Nd/Nwdurations,after id, and done, active, crit, and milestone tags.timelineyears,YYYY-MM, and ISO dates. A slash or dash between two dates is a period. Sections are not date spans.journeysections, a 1–5 score, and comma-separated actors.venn-betasetandunionlines. Two sets are area-proportional. Three sets are approximate. Text and styles are not drawn.
A frontmatter title, accTitle, and accDescr are read. accDescr or the title becomes a11y.alt. If neither is present, ChartKit writes one factual sentence from the data. Unknown syntax returns a CK8004 warning. Flowcharts and other diagrams return CK8003 and no spec. gantt, timeline, quadrantChart, venn-beta, and journey load from @chartkitdev/core/mermaid/phase4. fromMermaidAsync loads that chunk, and Node can import fromMermaid from the phase-4 entry directly.
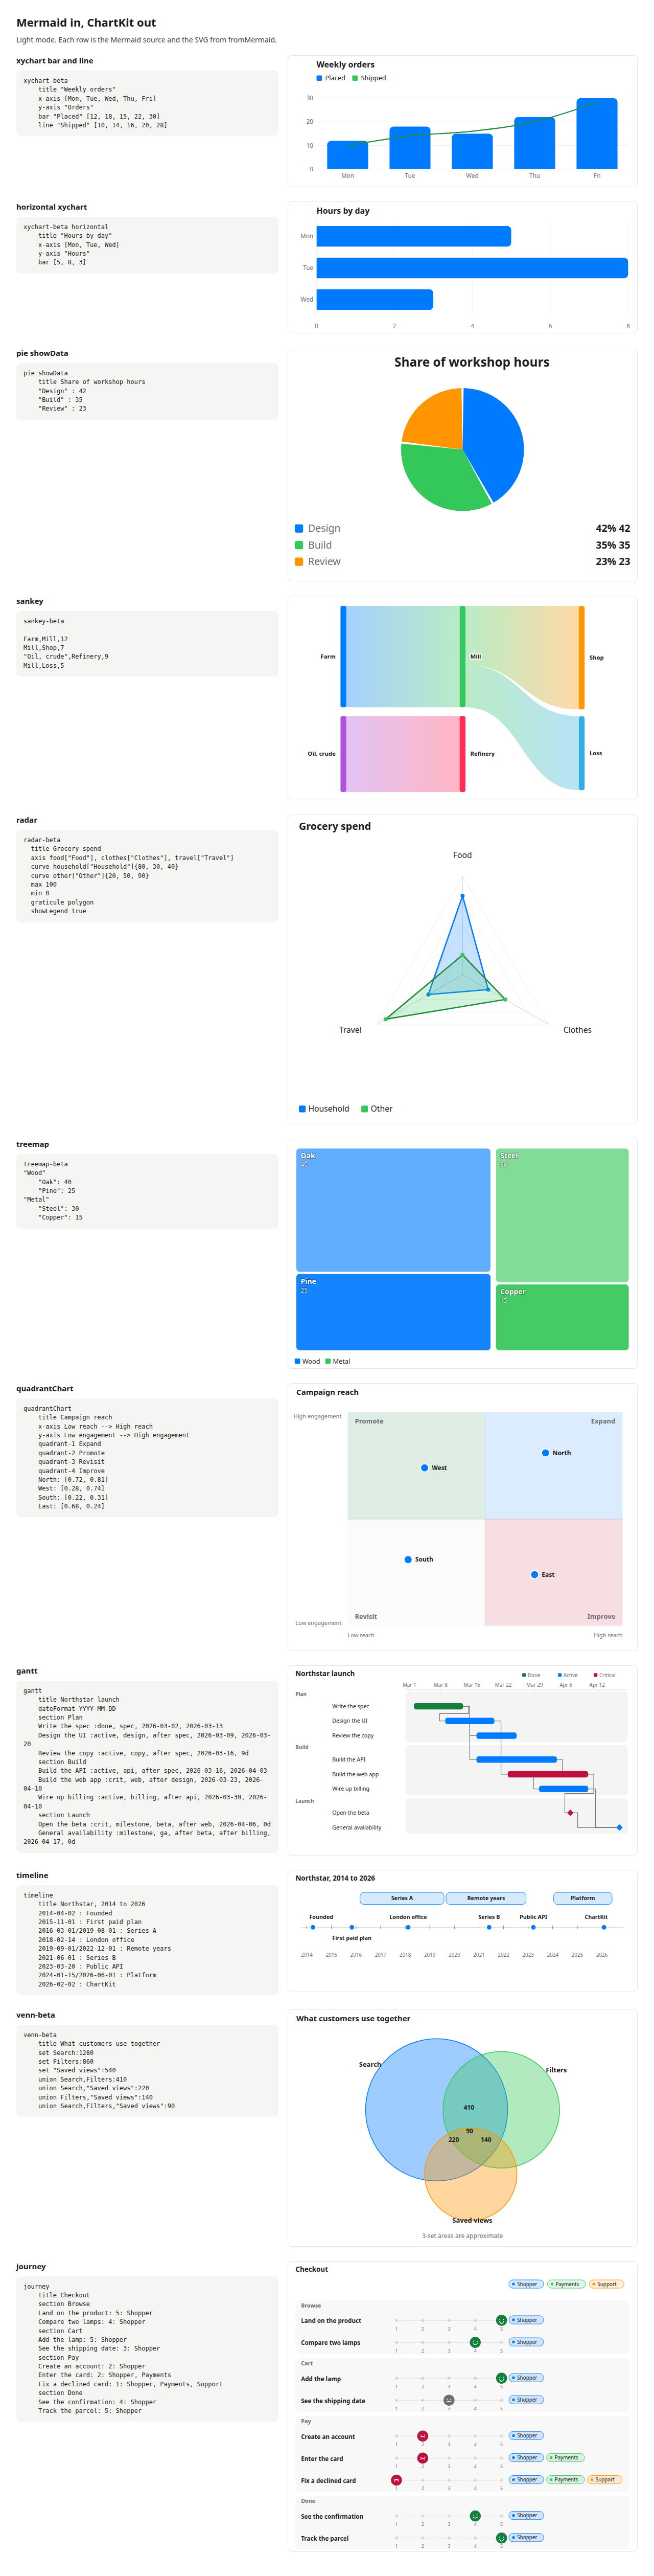
Markdown
In the browser, autoRender from @chartkitdev/vanilla/auto mounts pre.chartkit and code.language-chartkit. Mermaid fences are opt-in. The shorter Markdown page is the fence overview.
import { autoRender } from "@chartkitdev/vanilla/auto";

autoRender(document, { mermaid: true });
dist/chartkit.global.js draws the core charts and includes ChartKit.autoRender, ChartKit.fromMermaid, and ChartKit.toSpec. dist/chartkit.auto.global.js is auto-render without the Mermaid parser. data-chartkit-mermaid loads the sibling chartkit.mermaid.global.js, which loads chartkit.mermaid-phase4.global.js for gantt, timeline, quadrant, venn, and journey. Histogram through journey load chartkit.<type>.global.js from that same directory. Unsupported Mermaid blocks stay as source.
<script src="chartkit.global.js" data-chartkit-mermaid></script>
<pre class="mermaid"><code>pie
    title Share of workshop hours
    "Design": 42
    "Build": 35
</code></pre>
@chartkitdev/markdown turns the same fences into server SVG. Pass allowDangerousHtml to remark-rehype so the HTML node is kept.
import { rehypeChartkit, remarkChartkit } from "@chartkitdev/markdown";

remark().use(remarkParse).use(remarkChartkit).use(remarkRehype, { allowDangerousHtml: true });
rehype().use(rehypeParse).use(rehypeChartkit);
Limits
Column names come from the axis and series titles. One untitled series uses the y-axis title. With no names, the fields are x and value. A line whose scale is far from the bars uses axis: "y2". A y-axis range on xychart becomes encoding.y.scale.domain. axes.y is display-only. Radar draws a positive max from that domain, still starts at zero, and uses a polygon graticule. A treemap keeps one group level. Quadrant point radius is not drawn. showData prints the value in the legend.
Security
Fence text is data. The SVG renderer escapes labels, and Mermaid click and href lines are dropped rather than written as links. Sources longer than 100,000 characters are refused (CK8001). Charts keep at most 2,000 points (CK8002). Pass maxSource and maxPoints to change either cap. The global script does not scan Mermaid fences unless the script tag sets data-chartkit-mermaid.